All published articles of this journal are available on ScienceDirect.
Diffuse Appearance of Red Bone Marrow on MRI Mimics Cancer Metastasis and Might be Associated with Heavy Smoking
Abstract
Background:
Red bone marrow develops early in life and converts into yellow bone marrow with aging. Reconversion occurs when yellow bone marrow reconverts into red bone marrow due to increased oxygen demands.
Objective:
Diffuse appearance of red bone marrow on Magnetic Resonance Imaging (MRI) is rarely encountered.
Materials and Methods:
Seven patients, five male and two female, with the diffuse appearance of red bone marrow were evaluated. The average age was 71.4 (47-86) years old. All patients had been referred based on a working diagnosis of cancer metastasis. All patients were eventually rediagnosed with bone marrow reconversion.
Results:
Spinal MRI was evaluated in all patients, including the whole spine in four patients and lumbar spine in three patients. Six patients had slight anemia or close to the lower limit of normal hemoglobin (within 1mg/dl). Six patients were heavy smokers, having more than 20 cigarettes per day. Four patients had a history of stomach or bladder cancer (2 cases each). MRI revealed red bone marrow with a diffuse appearance and low signal intensity on T1- and T2-weighted images. Compared with the spinal cord/conus, the red bone marrow appeared isointense in about half of the cases, and in the other cases, the intensities were either slightly high or low. The signal of yellow bone marrow was isointense with the retroperitoneal fat.
Conclusion:
Diffuse red marrow can be difficult to differentiate from cancer metastasis. Compared to the MRI, signal intensity of the cord/conus is useful in the diagnosis of red marrow. Slight anemia may also be present. Heavy smoking might be related to the appearance of diffuse red marrow.
1. INTRODUCTION
At birth, bone marrow is cellular and hematopoietic and is called red bone marrow. Bone marrow becomes less hematopoietic with aging, and converts into the fat bone marrow, or yellow bone marrow [1]. The cellular components of red bone marrow include 60% hematopoietic cells and 40% fat cells. In contrast, yellow bone marrow is composed of 95% fat cells and 5% hematopoietic cells [1]. The conversion of red bone marrow to yellow bone marrow begins in the peripheral appendicular skeleton and proceeds to the central axial skeleton [2, 3]. The spine has the largest store of bone marrow in the body [1]. The pattern of spinal bone marrow conversion is centripetal, starting in the subcortical and subendplate regions and proceeding to the center of the vertebrae [4].
Bone marrow is a dynamic organ that continually changes. Red marrow may reconvert from yellow bone marrow when there is an increased oxygen requirement [5, 6]. Red marrow reconversion occurs in the opposite sequence of bone marrow conversion with aging [7]. Reconversion can occur in the setting of chronic illnesses [5, 8]. A history of heavy smoking has also been associated with marrow reconversion [9]. Magnetic Resonance Imaging (MRI) is a non-invasive technique to evaluate vertebral bone marrow, reflecting the cellular components. The routine spine evaluation on MRI includes T1-weighted and T2-weighted sequences [10]. The T1-weighted image intensity of red bone marrow is low but is higher than that of the intervertebral discs and paraspinal muscles [11]. On the other hand, the T1-weighted image intensity of yellow bone marrow is comparable to that of the subcutaneous fat [6, 10, 11].
In the current series, we report the diffuse appearance of red bone marrow on MRI mimicking cancer metastasis. MRI characteristics and clinical findings were compared.
2. MATERIALS AND METHODS
Diffuse appearance of red bone marrow on MRI was identified from medical files. All patients were referred for evaluation of abnormal bone marrow on MRI, with a working diagnosis of cancer metastasis. However, a final diagnosis of bone marrow reconversion was made in all patients. All patients were evaluated for a history of cancer, smoking, and anemia. Characteristic MRI signal intensity on T1-weighted and T2-weighted spinal images was assessed and compared to normal tissue, including spinal cord or conus for identification of red bone marrow and retroperitoneal fat for identification of yellow bone marrow.
3. RESULTS
A clinical summary is shown in Table 1. The patients included five males and two females, with a mean age of 71.4 ±13.6 years old, ranging from 47 to 86. All patients had a history of low back pain for which MRI was performed. The exact course of the low back pain and the medication used for it was not fully assessed, because the low back pain was non-specific and the degree of the pain was not severe in all cases. All patients were referred to our institute because MRI abnormality was noted following image analysis, and the disappearance of the low back pain was confirmed at the MRI examination. An association with back pain was excluded because the pain resolved in all patients. Spinal assessment included the lumbar spine in three cases. In the other four cases, spinal assessment included the entire cervical, thoracic and lumbar spine. Four out of seven cases had a history of cancer, including 2 stomach cancers and 2 bladder cancers. Smoking was seen in six cases. All smokers were heavy smokers, consuming more than 20 cigarettes per day. At the initial assessment, hematology analysis showed slight anemia with low hemoglobin values in four cases. Two cases were close to the lower limit of normal (within 1mg/dl).
| Age (yr) /Gender | RBC Count (normal range) | Hemoglobin (normal range) | Assessed Spines | Red Marrow Area at MRI Follow up (interval) | Cancer History | Smoking | |
|---|---|---|---|---|---|---|---|
| #1 | 66M | 331(400-500) | 12.5(12.8-17.6) | C, T, L | no change (18m) | stomach | 20/day |
| #2 | 83M | 341(315-470) | 12.8 (9.9-14.9) | C, T, L | no change (11m) | - | 20-30/day |
| #3 | 47F | 313(359-480) | 11.4 (10.7-14.5) | C, T, L | - | - | 20/day |
| #4 | 70M | 352(400-500) | 12.4(12.8-17.6) | L | no change (18m) | stomach | 20-80/day |
| #5 | 86M | 413(315-470) | 10.9(9.9-14.9) | C, T, L | no change (8m) | bladder | 40/day |
| #6 | 82F | 305(380-480) | 10.4(11-15) | L | slightly decrease (8y) | - | - |
| #7 | 66M | 256(334-529) | 10.7(11.3-16.3) | L | disappear* (12m) | bladder | 40/day |
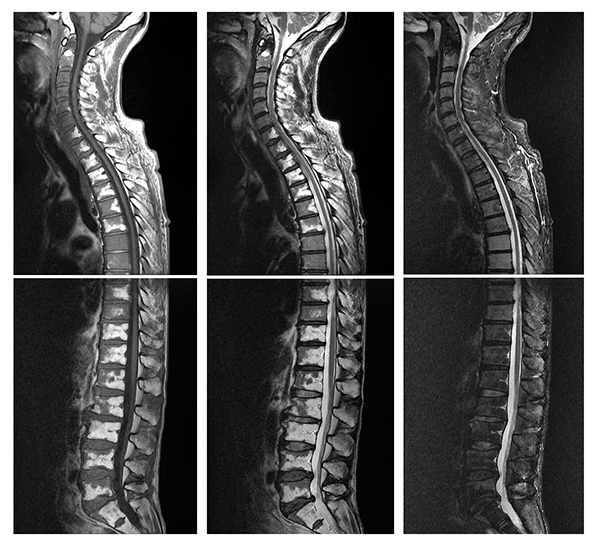
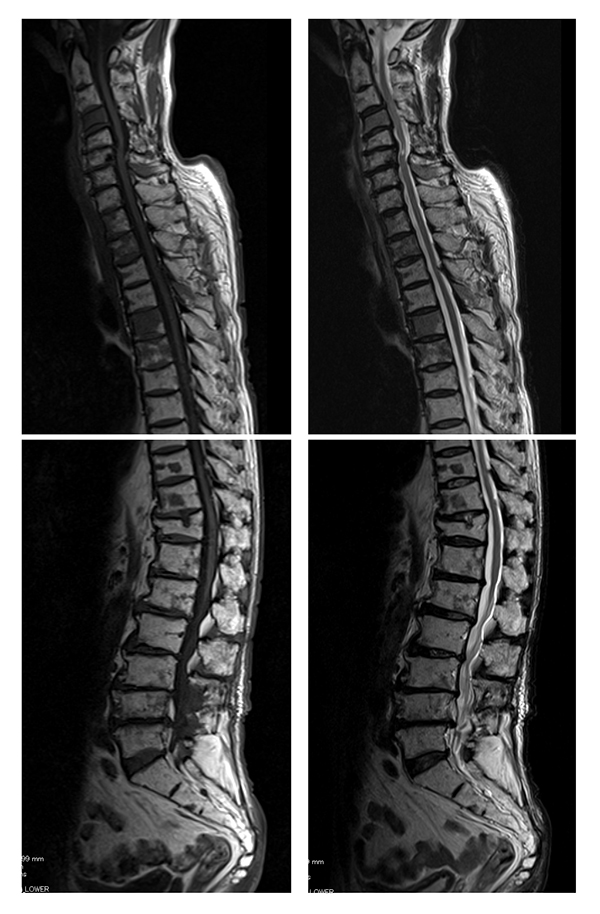
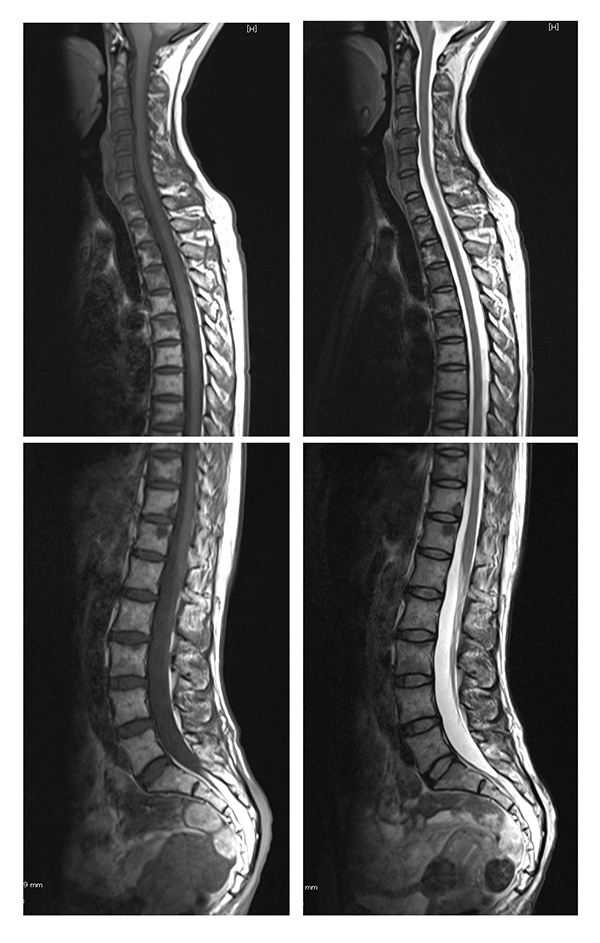
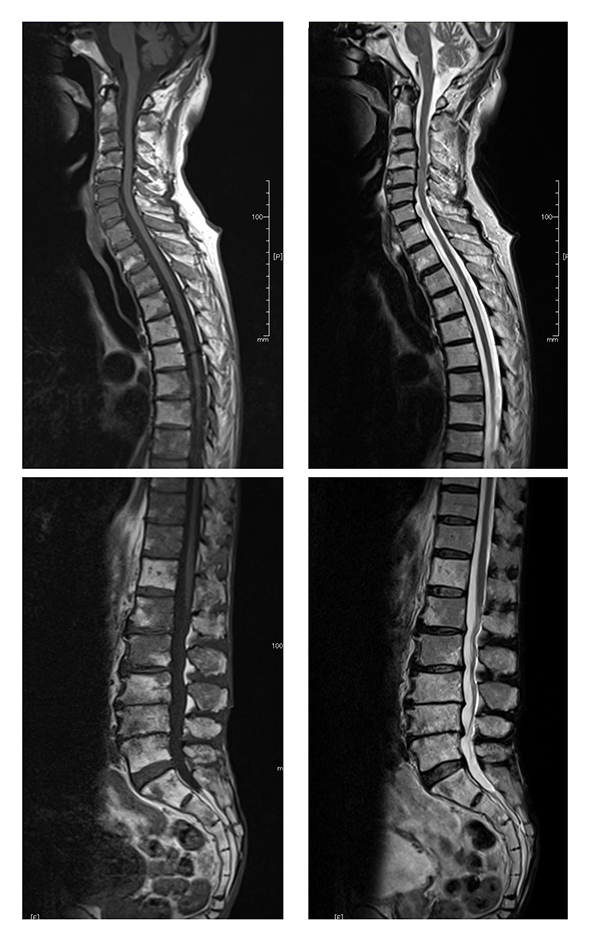
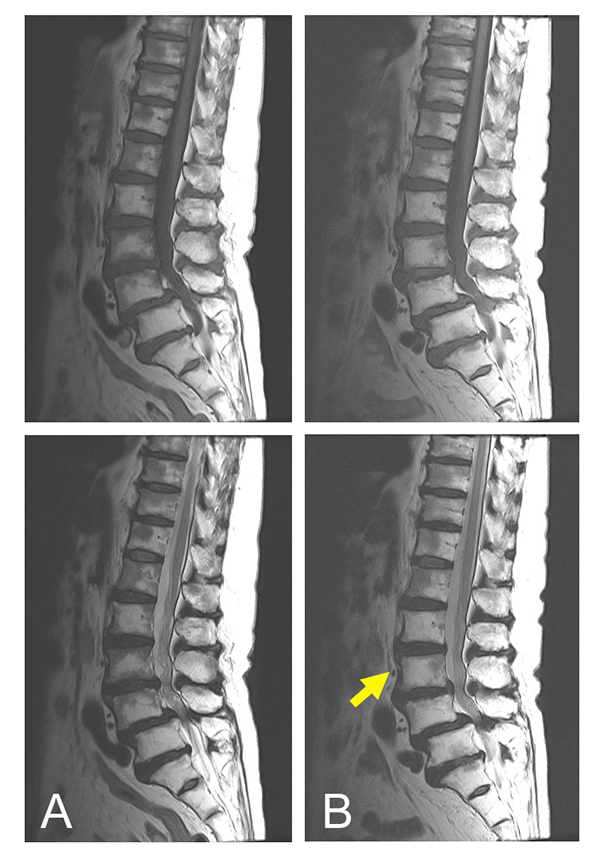
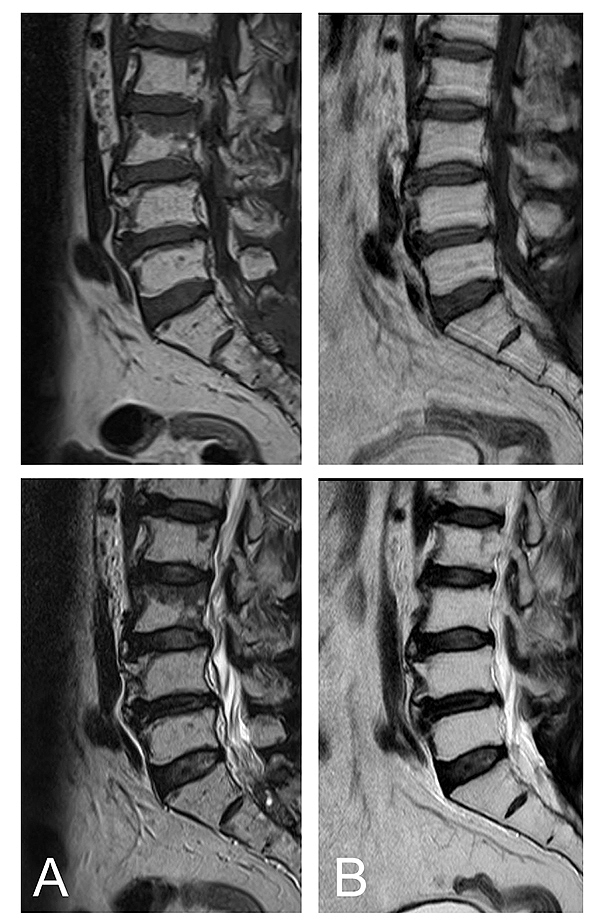
On MRI, all cases demonstrated a well-demarcated diffuse appearance of red marrow, with low signal intensity in both the T1- and T2-weighted images in either whole vertebrae or near the endplate and center of the vertebra (Figs. 1-6). There was no evidence of cortex destruction in any patient. A summary of MRI signal intensity is shown in Table 2. The signal intensity of the red bone marrow on T1-weighted images was iso to the spinal cord or conus in four cases (58%), slightly lower in one case (14%) and slightly higher in two cases (29%)(Figs. 1-3). On T2-weighted images, the signal intensity of the red bone marrow was iso in three cases (43%), slightly lower in two case (29%) and slightly higher in two cases (29%) (Figs. 1-4). The signal intensity of yellow bone marrow was the same as the retroperitoneal fat in all seven cases. Follow-up MRI was performed in six cases from 8 months to 8 years. On follow up imaging, all cases except one had no change or a slight decrease in the size of the low signal area (Fig. 5). In one case treated with radiation, the red bone marrow converted into yellow bone marrow on follow up (Fig. 6).
| MRI Signal Intensity | Red Bone Marrow (n=7) | Yellow Bone Marrow (n=7) | ||
|---|---|---|---|---|
| - | T1-WI [n(%)] |
T2-WI [n(%)] |
T1-WI [n(%)] |
T2-WI [n(%)] |
| Slightly lower than spinal cord | 1 (14%) | 2 (29%) | - | - |
| Iso to spinal cord | 4 (58%) | 3 (43%) | - | - |
| Slightly higher than spinal cord | 2 (29%) | 2 (29%) | - | - |
| Iso to retroperitoneal fat | - | - | 7 (100%) | 7 (100%) |
4. DISCUSSION
In the current case series, we report the unique MRI appearance of a mixture of red and yellow bone marrow. With aging, the bone marrow becomes increasingly replaced with fatty marrow [10]. Red bone marrow tends to be diffused in the axial bone marrow in patients under the age of 40 years, with only small areas of yellow marrow around the basivertebral plexus [3]. The pattern of spinal bone marrow conversion is centripetal, starting in the subcortical and subendplate regions and proceeding to the center of the vertebral body [6]. Three patterns have been reported, including a band-like pattern of fatty replacement along the endplates, small foci of fatty marrow replacement, and large globular areas of fat replacement [3]. Red bone marrow reconversion from yellow bone marrow may occur when there is an increased oxygen requirement [5, 6]. The pattern of reconversion occurs in the opposite sequence of bone marrow conversion [7]. In this series, we identified variations in the location of red bone marrow, which was seen in whole vertebrae, in endplates, and at the center of vertebrae. These patterns appear to be typical of red bone marrow reconversion.
The signal intensity of red bone marrow on T1-weighted images is low, but is higher than that of the intervertebral discs and paraspinal muscles [11]. Intervertebral discs degenerate with aging and signal intensity in degenerative discs tends to decrease. Therefore, it may be misleading to compare the signal intensity of bone marrow to that of the intervertebral discs, especially in the elderly. In our series, the spinal cord or conus was used for comparison to red bone marrow. In about half of the cases, the red bone marrow was iso intense to the spinal cord or conus. Furthermore, the other cases had only slightly lower or higher intensity as the spinal cord or conus. Hence, comparison to the spinal cord or conus is useful in the diagnosis of bone marrow reconversion. On the other hand, the signal intensity of yellow bone marrow is reported to be similar to that of the subcutaneous fat [6, 10, 11]. In our series, we found that retroperitoneal fat had the similar signal intensity to the yellow bone marrow. Hence, comparison to the retroperitoneal fat is useful in the diagnosis of yellow bone marrow. The natural history of reconverted red bone marrow appears to be stable, as five out of six cases had no change or slightly decreased area during a maximum follow up period of 8 years.
All study patients were referred to our institute with a working diagnosis of cancer metastasis. The differential diagnosis of bone marrow abnormalities includes malignancies such as multiple myeloma, non-Hodgkins lymphoma, metastatic non-small cell lung cancer, and metastatic adenocarcinoma [12]. The diagnosis of reconversion and the exclusion of cancer metastasis was made not only with MRI findings but also with follow up imaging. Metastatic lesions are usually brighter than normal bone marrow on T2-weighted images. However, it can be difficult to differentiate metastatic lesions from normal marrow on T2-weighted sequences [10, 13]. The halo sign, characterized by a rim of bright signal intensity on T2-weighted images, may indicate the presence of malignancy [14]. Infection (i.e., osteomyelitis) is also part of the differential diagnosis of abnormal bone marrow signal intensity [12]. In the current series, multi vertebral signal intensity and the absence of clinical signs of infection excluded infection in all seven patients.
Several clinical characteristics were associated with the diffuse appearance of red bone marrow in this series. Most patients in this series were elderly, with an average age of 71.4 years old, and the youngest age of 47 years old. Although, all patients had a history of back pain, the pain resolved and was thus not considered in the association analysis. Moreover, non-specific low back pain might not explain MRI abnormality in the whole spine. Four patients had a history of cancer. The association between cancer and reconversion is unknown, because patients with a history of cancer tend to have extensive investigations, and thus have a higher probability of identifying reconversion. Most patients in this series had mild anemia. Red bone marrow reconversion occurs when oxygen requirements increase [5, 6]; hence, compensation by reconversion may have occurred leading to mild anemia. A heavy smoking history has been significantly associated with marrow reconversion [7]. Chronic smoking may result in tissue hypoxia because of elevated carboxyhemoglobin levels [7]. In our series, heavy smoking, having more than 20 cigarettes a day, was seen in six out of seven cases. Thus, heavy smoking appears to be associated with reconversion. However, one female patient had no history of smoking, and was otherwise healthy. Further investigation of such cases is required to understand the as-yet-unidentified factors associated with reconversion.
CONCLUSION
In the current series, we report the diffuse appearance of red bone marrow on MRI mimicking cancer metastasis. The diagnosis of bone marrow reconversion on MRI can be made by comparison of red bone marrow intensity to that of the spinal cord and by comparison of the yellow bone marrow intensity to that of the retroperitoneal fat. Mild anemia was seen in most cases and may be a compensated condition. The association of bone marrow reconversion with cancer is unknown, but heavy smoking might be related to the condition.
ABBREVIATION
| MRI | = Magnetic Resonance Imaging |
ETHICS APPROVAL AND CONSENT TO PARTICIPATE
Not applicable.
HUMAN AND ANIMAL RIGHTS
No animals/humans were used for studies that are the basis of this research.
CONSENT FOR PUBLICATION
All patients represented in this study were informed that the data from their case would be de-identified and used in a journal publication.
CONFLICT OF INTEREST
The authors declare no conflict of interest, financial or otherwise.
ACKNOWLEDGEMENTS
Declared none.

