All published articles of this journal are available on ScienceDirect.

Meniscus Induced Cartilaginous Damage and Non-linear Gross Anatomical Progression of Early-stage Osteoarthritis in a Canine Model
Authors Info & Affiliations
Abstract
Background:
The predictable outcome of the anterior cruciate ligament transection (ACLT) canine model, and the similarity to naturally occurring osteoarthritis (OA) in humans, provide a translatable method for studying OA. Still, evidence of direct meniscus-induced cartilaginous damage has not been identified, and gross-anatomical blinded scoring of early-stage OA has not been performed.
Objective:
A gross anatomical observation and statistical analysis of OA progression to determine meniscus induced cartilaginous damage, to measure the macroscopic progression of OA, and to address matters involving arthroscopic and surgical procedures of the knee.
Method:
Unblinded assessment and blinded scoring of meniscal, tibial, femoral, and patellar damage were performed for control and at four time points following unilateral ACLT: 3-week (N=4), 8-week (N=4), 12-week (N=5), and 25-week (N=4). Mixed-model statistics illustrates damage (score) progression; Wilcoxon rank-sum tests compared time-point scores; and Wilcoxon signed-rank tests compared ACLT and contralateral scores, and meniscus and tibia scores.
Result:
Damage was manifest first on the posterior aspect of the medial meniscus and subsequently on the tibia and femur, implying meniscal damage can precede, coincide with, and aggravate cartilage damage. Damage extent varied chronologically and was dependent upon the joint component. Meniscal damage was evident at 3 weeks and progressed through 25-weeks. Meniscal loose bodies corresponded to tibial cartilage damage location and extent through 12 weeks, followed by cartilage repair activity after complete meniscal degeneration.
Conclusion:
This study provides additional information for understanding OA progression, identifying OA biomarkers, and arthroscopic and meniscectomy procedures.
INTRODUCTION
Knee osteoarthritis (OA) commonly occurs in humans and animals, and while primary OA is of unknown etiology, the consequence of surgically induced cruciate ligament insufficiency is the reliable development of OA. As such, anterior cruciate ligament transection (ACLT) has been used experimentally to mimic and to study the natural history of the development of early OA. The canine ACLT model provides opportunities to study the early progression of joint damage and repair [1-3] induced through mechanical instability, which progresses quite similarly as in humans [4, 5]. Furthermore, it provides a highly controlled and useful system for studying the early pathogenesis of OA, particularly early changes in joint surface damage location and severity [4, 6], and cartilage morphology [1, 2, 7-9].
To surgeons and pathologists alike, the visual assessment of cartilage surface damage in OA is difficult due to variations in the extent, localization, and timing of damage. And even with the advent of arthroscopy, the ability to clinically assess cartilage surfaces over time, particularly in the early natural history of OA, is limited by ethical and practical considerations. To overcome this issue, integer-based scoring provides an index of the complex spectra of tissue damages, which can be used to classify OA progression. Several scoring systems are currently available [5, 10-14] and provide methods for classifying joint damage at the macroscopic, mesoscopic, and microscopic levels, including assessments of lesion activity, tissue hypertrophy, and molecular alterations. Since macroscopic scoring is a clinically important aspect in cartilage health assessment, several scoring methods include a separate gross-pathology scoring scheme [5, 13, 14]. Although the widespread joint effects of ACLT are well documented, studies have yet to show the time-dependent blinded scoring for early stage OA; rarely focus on the variations over time; and have not shown positive correlation of damage and extent through anatomical part interactions (e.g., correlation between meniscus and tibial damage). In fact, there may be a delayed onset of cartilage damage caused by a torn meniscus, or readily visible damage which occurs only at the early stages of OA. In the canine model, later events may be particularly difficult to assess due to hypertrophic repair activity that frequently occurs in canine.
The morphological study reported here is the first part of a multi-disciplinary, functional imaging study of joints with surgically induced knee OA [15, 16] in canines at four different stages of early degradation. It forms the foundation of our ongoing research (including microscopic magnetic resonance imaging [15, 16], polarized light microscopy [17], Fourier-transform infrared imaging [18], microscopic computer tomography [17], biomechanics [19], and histology [20]) to test the functional relationship between macroscopic and molecular signatures of OA pathology that might define mechanisms of initiation of OA. Therefore, this macroscopic study is an important first step in a multivariate analysis of cartilage structure and function after surgically induced injury. This analysis aims to describe the macroscopic anatomical changes between, and damage correlations of the tibia, femur, patella, and meniscus in the mechanically unstable and stable canine knees. Through visual scoring of knee damage we aim to define a time-point or range for the very earliest and subsequent tissue changes that occur after cruciate transection to aid in defining the structural features associated with the initiation of surgically induced OA. We also aim to describe the broader observations concerning OA progression that have not been entirely addressed in the literature.
MATERIALS AND METHODS
Sample Preparation and Imaging
A total of 21 skeletally mature canines (1.5-4 years old; 18-28 kg weight; male and female) from a complex early- stage OA study underwent gross anatomical assessment of the stifle joints. Animals were cared for by a veterinarian according to the guidelines of the Canadian Council of Animal Care with the approval of the institutional ethical committee. Of the 21 canines, 17 were subject to ACLT in one stifle and four were unaltered (non-operated) controls. All variables (age, gender, weight, and operated side) were randomized. The 17 canines that received ACLT were euthanized at four different time delays after surgery: 3 weeks (N=4), 8 weeks (N=4), 12 weeks (N=5), and 25 weeks (N=4). At necropsy, the intact (unopened joint capsule) knees (control, ACLT, and contralateral) from each canine were shipped overnight at 4°C to the imaging facilities. The knees were dissected within 24 hours of euthanasia and the tibia, femur, and menisci (attached to the tibia) were then photographed using the macro setting on a 10-megapixel camera (Canon PowerShot SD880 IS) for assessment of joint surface health. During imaging, lighting was provided by standard overhead fluorescent tube fixtures and adjustable fluorescent lamps with circular tubes. The tibial surfaces were photographed before and after removal of the menisci and processed for MR and CT imaging. The menisci and patellae were removed from the stifle, wrapped in saline-soaked gauze, sealed in glass vials, and stored at -80°C. Menisci and patellae were later thawed at room temperature, kept moist in a plastic tray, and photographed on an adjustable platform to control the distance to the tripod-mounted camera. All images were saved as jpeg files (3648 x 2736 pixels), cropped to minimize background, and minor changes in image brightness were applied to entire images to match the image panel prior to blinded analysis.
Blind Study
Photographic images of articular cartilage surfaces (femora, tibiae, and patellae) and menisci were scored blinded to the treatment (ACLT) as an unbiased assessment of joint heath. All macroscopic images were randomized and presented to six observers (five observers for the patella), including a radiologist and a D.V.M., who scored each image without a priori knowledge of the OA time-point. A grading scale describing damage severity was presented for each anatomical structure. Published grading schemes [5, 13, 14] were used for scoring the tibia, femur, meniscus and patella, with only minor alteration to the description for score (see below). Each observer was presented with individual images and asked to score each specimen without consultation. The organizers of the study did not participate in this portion of scoring to avoid bias. In addition to damage severity, the observers were also asked to assess the image quality based on photographic angle, image clarity, and lighting. One 3-week contralateral femur, two 8-week contralateral tibiae, and five lateral control menisci, and a full compliment of all other anatomical sections and time point groups were included in scoring (less than 1% of meniscus, tibia, and patella images, and 1.4% of femur images were not included in the results).
Meniscus Scoring
Meniscus scoring was performed using images showing only the proximal (cranial) articular surface. The OARSI canine macroscopic scoring procedure [5] was used, with a minor modification that considered the meniscus as a whole instead of a three-section body, while still assessing for overall size and extent of damage (fibrillation, degeneration, etc.) and tearing. Additionally, based on unblinded observations during dissection and model-specific information in the literature [21], we added the criteria of tissue discoloration and deformation, which can be an OA antagonist [22] and may present as a precursor to tearing. These scoring changes can only result in a maximum score of 1, since other, more severe forms of damage elicit higher scores. Tear and lesion assessment was evaluated using standard scoring and rubric methods [5, 11] for type and severity of tear, and tissue quality. The scoring range was 0 to 4 where 0 indicated no damage and 4 indicated significant damage. Criteria changes are explained below and Table 1 provides a qualitative description for scoring each meniscus.
| Score | Striation | Discoloration | Deformation | Tearing | Quality |
|---|---|---|---|---|---|
| 0 | faint | none | none | none | non- degenerative |
| 1 | dark; thick |
focal | present | none; partial |
non- degenerative |
| 2 | np | np | np | complete; non-complex |
non/low degeneracy |
| 3 | np | np | np | complete; complex |
moderate degeneracy |
| 4 | np | np | np | np | complete structural loss |
Striation
Any dark lines (striation) on the proximal face of the meniscus. Striation patterns were judged based on the visual characteristics of the striation lines. Darker and more frequent striations were interpreted as indicating more severe damage. Faint striations are a normal feature of menisci, which served as “background” texture (score = 0) for evaluating meniscal damage.
Discoloration
Focal or general discoloration, typically reddening, anywhere on the meniscal face, edge, or immediate surrounding tissue.
Deformation
Any deviation from the normal smooth, continuous crescent edges of a healthy meniscus was interpreted as proportionate to severity of meniscal damage.
Tibia, Femur, and Patella Scoring
During unblinded preliminary assessment, we observed discoloration and deformation that are not often reported in the literature. Therefore, in addition to the Outerbridge [13], Mastbergen [14], and OARSI [5] scores, we included discoloration, abrasion, and deformation of the load-bearing regions (cartilaginous surfaces and edges). Non-scored assessment included tissue growth in the non load-bearing regions (intercondylar area) of the tibiae and femora. Description of the tibia, femur, and patella used standard anatomical directions (posterior, anterior, etc.) as well as the meniscus-covered and meniscus-uncovered region of the condyle face, in order to identify meniscal influence on cartilage damage. Additional criteria are explained below and a scoring summary is summarized in Table 2 for the tibia, femur, and patella.
Discoloration
Focal and general discoloration (typically reddening) occurring on the cartilaginous face, around the edges, in the intercondylar area (tibia and femur only), or in the immediate surrounding tissue.
Deformation
Alterations in the normal glassy structural appearance of the tibial and femoral condyles, and alteration in the shape of a healthy canine patella (teardrop-shaped with a wider distal body). In advanced cases, deformation may present as pathological growth (chondro-osteophytes), bone remodeling, or cartilage delamination.
Intercondylar Growth (Tibia and Femur Only)
Cartilaginous growth encroaching on the intercondylar areas of both the tibia and femur. In severe cases, the growth may cover the entire intercondylar area.
Abrasions
Abrasions appear on the cartilaginous face as a broad darkening where surface tissue has been worn. Abrasion is a term being used to describe only the appearance of the cartilaginous surface, and may be surface tissue delamination.
| Score | Discoloration | Deformation | Fibrillation, Abrasions, and Lesions |
|---|---|---|---|
| 0 | none | none | none |
| 1 | present | present | fibrillated or abrased surface |
| 2 | present * | present * | fibrillated or abrased surface with minor focal lesions |
| 3 | present * | present * | deep moderate lesions; damage to the tissue surrounding the lesion |
| 4 | present * | present * | large deep lesions with severe damage to large areas of the tissue |
Statistics
Blinded scores were subjected to linear mixed-model using JMP® Pro 11 (SAS Institutes Inc., NC) for continuous score and ordinal post-operative time-points. Wilcoxon rank-sum tests using KaleidaGraph (Synergy Software, PA) determined inter-group correlations (e.g., individual ACLT time-points); Wilcoxon signed-rank tests determined intra-group correlations (e.g., 3-week ACLT versus 3-week contralateral); and meniscus-tibia damage correlations (secondary statistics).
RESULTS
Observations
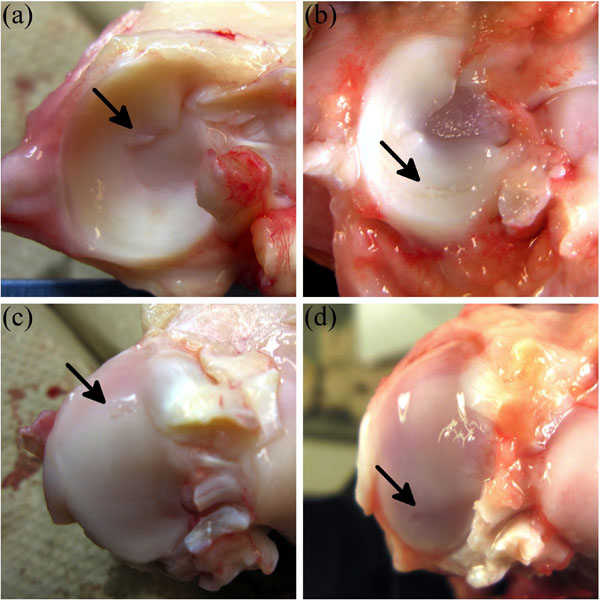
Most control menisci appeared healthy (Fig. 1a), except one medial control meniscus presented with a mid-anterior defect on the interior edge (Fig. 2a); directly beneath the small meniscal projection was a minor lesion (Fig. 2c). One control lateral meniscus presented with a small mid-anterior projection on the inner edge, but there was no apparent cartilaginous damage.
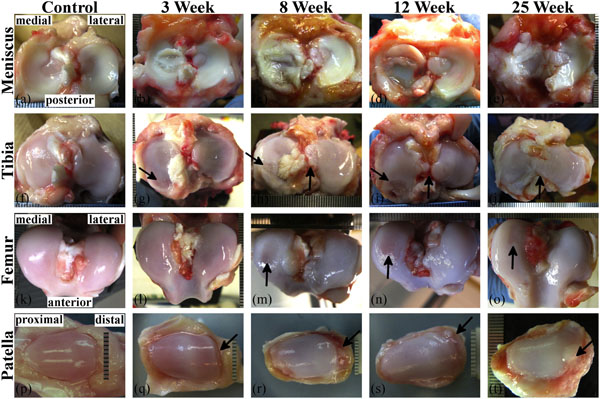
The medial ACLT meniscus presented with tearing at 3-weeks (N=3), became noticeably degenerated by 8-weeks, and extensively degenerated by 25-weeks (Fig. 1b-e). One 12-week canine presented with only minor damage to the ACLT and contralateral sides. The lateral meniscus exhibited damage as well, but less extensive than the medial meniscus. Discoid menisci were present for control (N=1), 8-week (N=2), 12-week (N=2), and 25-week (N=1) groups from only the lateral plateau. For the 8- and 12-week groups, the discoid shape was symmetric across joints of the respective canine. Discoloration presented at 3-weeks. The tissue around the lateral ACLT meniscus (and tibia) presented with minor discoloration at 3- weeks, and became more discolored through 25-weeks.
The tibia presented with minor posterior damage (lesion) on two 3-week medial ACLT condyles beneath menisci with multiple longitudinal tears (Fig. 1b, g) and a horizontal tear (Fig. 2b, d), and edge swelling (ridge remodeling) at 3-weeks (Fig. 1f). The posterior lesion became more frequent and severe at 8-weeks (Fig. 1h) and 12-weeks (Fig. 1i), but posterior lesions were not present at 25-weeks (Fig. 1j). Localized posterior lesions of the medial ACLT tibial condyle matched well with tear location of the meniscus. The most severe lesions induced by the OA model were localized mainly at the posterior aspect of the medial tibial condyles. Intercondylar area tissue growth of ACLT tibiae steadily increased from 8-weeks through 25-weeks (Fig. 1h-j), and appeared to originate from the intercondylar eminence. There was a vascularized anterior pannus appearing to originate from the synovium, attached to the anterior cartilage surface on one lateral 8-week plateau (Fig. 1k), one lateral and one medial 12-week plateau, and three medial 25-week plateaus; cartilage had been removed beneath the pannus (Fig. 1l). A comparison between the meniscus-covered and -uncovered region of ACLT tibiae showed swelling and fibrillation (with occasional minor surface lesions) presented at the uncovered region at early OA stages (3-weeks) and quickly reduced (around 8-weeks). In contrast, damage to the covered region did not appear reduce until later stages (around 25-weeks). Fibrillation also appeared to match damage patterns of the meniscus.
Femoral condyle damage was not observed until around 8-weeks (Fig. 1m) and presented as condyle deformation, surface abrasions, and lesions. Overall, condyle damage appeared to be most extensive at 8-weeks for both the lateral and medial condyles, then decrease in severity through 25-weeks. Intercondylar growth and discoloration tended to be progressive in 8-, 12-, and 25-week femora (Fig. 1m-o). One 8-week medial condyle exhibited a severe lesion with extensive peripheral damage (image not shown).
Control patella (Fig. 1p) had a smooth surface and teardrop shape. Patellar damage was readily visible in all ACLT knees and presented initially around 3-weeks (Fig. 1q) as minor fibrillation on the central face, and minor edge wear or delamination (typically distal). Extensive damage presented as moderate surface fibrillation, deformation, cartilage delamination, and chondro-osteophyte growth at 8-weeks (Fig. 1r), and remained prominent through 12- (Fig. 1s) and 25- weeks (Fig. 1t).
| Meniscus | Tibia | Femur | Patella | |||||||||||||||
|---|---|---|---|---|---|---|---|---|---|---|---|---|---|---|---|---|---|---|
| 3 wk | 8 wk | 12 wk | 25 wk | 3 wk | 8 wk | 12 wk | 25 wk | 3 wk | 8 wk | 12 wk | 25 wk | 3 wk | 8 wk | 12 wk | 25 wk | |||
| ACLT | Medial | Control | 0.005 | <0.001 | <0.001 | <0.001 | >0.99 | 0.000 | <0.001 | 0.001 | 0.560 | <0.001 | <0.001 | 0.003 | 0.018 | <0.001 | <0.001 | <0.001 |
| 3 week | <0.001 | 0.002 | <0.001 | 0.001 | <0.001 | 0.003 | <0.001 | <0.001 | 0.044 | <0.001 | 0.001 | <0.001 | ||||||
| 8 week | 0.003 | 0.758 | 0.950 | 0.258 | 0.840 | 0.007 | 0.284 | 0.955 | ||||||||||
| 12 week | 0.001 | 0.228 | 0.001 | 0.325 | ||||||||||||||
| Lateral | Control | 0.296 | <0.001 | 0.001 | 0.002 | 0.013 | 0.000 | <0.001 | <0.001 | 0.212 | <0.001 | <0.001 | 0.010 | |||||
| 3 week | 0.004 | 0.035 | 0.042 | 0.169 | 0.135 | 0.155 | 0.002 | 0.001 | 0.267 | |||||||||
| 8 week | 0.452 | 0.267 | 0.970 | 0.982 | 0.822 | 0.022 | ||||||||||||
| 12 week | 0.801 | 1.000 | 0.013 | |||||||||||||||
| Contralateral | Medial | Control | 0.025 | 0.404 | 0.830 | 0.380 | <0.001 | 0.220 | 0.691 | 0.926 | 0.765 | 0.315 | 0.007 | 0.598 | 0.903 | 0.669 | 0.318 | 0.578 |
| 3 week | 0.073 | 0.006 | 0.000 | 0.017 | 0.000 | 0.000 | 0.813 | 0.298 | >0.99 | 0.764 | 0.271 | 0.684 | ||||||
| 8 week | 0.233 | 0.026 | 0.349 | 0.321 | 0.188 | 0.668 | 0.180 | 0.985 | ||||||||||
| 12 week | 0.435 | 0.830 | 0.065 | 0.102 | ||||||||||||||
| Lateral | Control | 0.774 | 0.046 | 0.300 | 0.400 | 0.878 | 0.195 | 0.405 | 0.065 | 0.522 | 0.528 | 0.755 | 0.307 | |||||
| 3 week | 0.034 | 0.225 | 0.278 | 0.216 | 0.575 | 0.129 | 0.346 | 0.439 | 0.230 | |||||||||
| 8 week | 0.369 | 0.232 | 0.097 | 0.025 | 0.751 | 0.770 | ||||||||||||
| 12 week | 0.831 | 0.293 | 0.503 | |||||||||||||||
Blinded Scoring and OA Progression
Wilcoxon rank-sum comparisons show many significant differences between time-point dependent scores, and correlates well with the statistical damage trend depicted through the linear mixed model. In the following paragraphs, blind-study scores are graphically presented in figures 3 through 6 for the meniscus, tibia, femur, and patella, respectively. Significant differences indicate Wilcoxon rank-sum comparisons of blinded scores (Table 3); and descriptions of increasing or decreasing damage indicate significant (unless stated otherwise) score change as a function of time-point as measured by mixed-model statistics (Table 4).
Meniscus
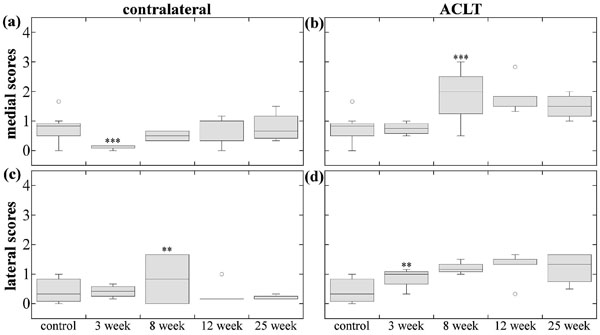
Medial contralateral meniscus scores (Fig. 3a) at 3-weeks were significantly different and decreased from control scores, likely due to the edge defects seen in medial control menisci. Lateral meniscus (Fig. 3c) 8-week scores were significantly different than lateral control and 3-week, and significantly increased at 8-weeks, which was likely due to increased presence of discoid-menisci.
At 3-weeks the menisci exhibited variable extent of damage, ranging from minor partial tears to complex complete tears. In contrast, 8-, 12- and 25-week damage extent appeared to be less variable within each group (Fig. 3b). Medial ACLT meniscus scores exhibited significant differences between all time-point groups except 8- and 25-weeks, with increasing damage scores through 8-weeks, a decrease at 12-weeks, followed by an increase at 25-weeks that scored the same as 8-week medial menisci. Lateral ACLT scores were consistent (Fig. 3d); 8-, 12-, and 25-week meniscus scores were significantly different than the control and 3-week groups; damage scores increased from 3-weeks to 8-weeks.

Tibia
Medial contralateral tibial scores (Fig. 4a) were significantly different and decreased at 3-weeks, which may have been due to the minor lesion on the control tibia caused by the meniscal projection. Lateral tibia score (Fig. 4c) comparisons were trivial, but there was a significant difference between 8-week and 25-weeks, with a nearly significant increase at 8- weeks and a significant decrease at 12-weeks.
Medial ACLT tibia scores (Fig. 4b) appeared to increase through 8-weeks, then slightly decrease through 25-weeks. Group scores were significantly different, except for combinations of 8-, 12-, and 25-weeks comparisons; damage significantly increased at 8-weeks, and decreased (nearly statistically significant) at 25-weeks. All lateral ACLT tibia group scores (Fig. 4d) were significantly different than lateral control, but significantly increased at only 3-weeks.
| Meniscus | Tibia | Femur | Patella | |||||||
|---|---|---|---|---|---|---|---|---|---|---|
| slope | p value | slope | p value | slope | p value | slope | p value | |||
| ACLT | Medial | 3 week | 1.417 | <0.001 | -0.021 | 0.926 | 0.089 | 0.664 | 0.450 | 0.106 |
| 8 week | 1.792 | <0.001 | 1.125 | <0.001 | 1.500 | <0.001 | 1.700 | <0.001 | ||
| 12 week | -0.708 | 0.003 | -0.008 | 0.973 | -0.142 | 0.520 | -0.470 | 0.104 | ||
| 25 week | 0.750 | 0.002 | -0.367 | 0.138 | -0.817 | <0.001 | 0.470 | 0.104 | ||
| Lateral | 3 week | -0.250 | 0.269 | 0.438 | 0.020 | 0.196 | 0.260 | |||
| 8 week | 0.667 | 0.004 | 0.333 | 0.122 | 0.792 | <0.001 | ||||
| 12 week | -0.158 | 0.460 | 0.025 | 0.902 | -0.083 | 0.655 | ||||
| 25 week | -0.092 | 0.669 | -0.025 | 0.902 | -0.500 | 0.008 | ||||
| Contralateral | Medial | 3 week | -0.500 | 0.010 | -0.646 | <.001 | 0.048 | 0.883 | 0.000 | >0.99 |
| 8 week | 0.292 | 0.127 | 0.375 | 0.087 | 0.056 | 0.873 | 0.500 | 0.019 | ||
| 12 week | 0.267 | 0.142 | 0.200 | 0.343 | 0.578 | 0.010 | -0.683 | 0.001 | ||
| 25 week | 0.108 | 0.549 | 0.092 | 0.587 | -0.633 | 0.002 | 0.233 | 0.249 | ||
| Lateral | 3 week | -0.125 | 0.506 | -0.021 | 0.890 | 0.238 | 0.261 | |||
| 8 week | 0.458 | 0.036 | 0.417 | 0.052 | -0.333 | 0.146 | ||||
| 12 week | -0.167 | 0.419 | -0.500 | 0.016 | 0.042 | 0.783 | ||||
| 25 week | -0.125 | 0.544 | -0.125 | 0.448 | -0.042 | 0.766 | ||||
Femur
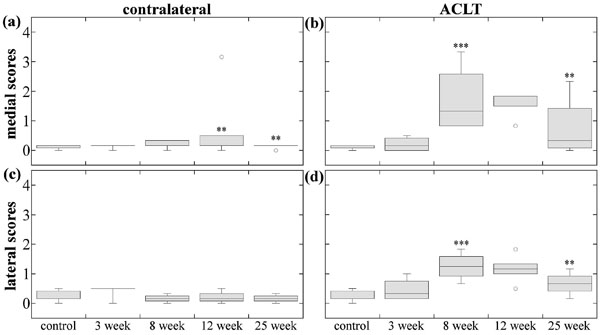
Medial contralateral femur scores (Fig. 5a) significantly increased at 12-weeks then decreased at 25-weeks. Lateral contralateral scores (Fig. 5c) exhibited no significance.
Both medial ACLT femur scores (Fig. 5b) and lateral ACLT femur scores (Fig. 5d) exhibited similar damage. There were significant different between most group scores; scores increased through 8-weeks, then decreased through 25-weeks.
Patella
Contralateral patella scores (Fig. 6a) exhibited no significant differences at 3-weeks, then increased at 8-weeks, and decreased at 12-weeks. The 8-, 12-, and 25-weeks ACLT patella group scores (Fig. 6b) were significantly different than control and 3-weeks, and exhibited significant increase at 8-weeks. The damage slightly decreased then increased at 12- and 25-weeks, respectively, although not significant statistically.
ACLT patella scores suggest damage occurs soon after ACL transection. The small variation of same time-point groups (except for the one 12-week outlier) indicates consistent patellar damage. Therefore, patella may provide a good subject for early biomarker study of OA.

Intragroup Statistics
Wilcoxon signed-rank test (Table 5) shows significant difference in scores between all groups (e.g., 3-week ACLT compared with 3-week contralateral) and anatomical parts, except for 3-week lateral meniscus, 8-week lateral tibia, and 3-week medial and lateral femur.
| Meniscus | Tibia | Femur | Patella | ||
|---|---|---|---|---|---|
| Medial | 3-weeks | <0.001 | <0.001 | >0.99 | 0.033 |
| 8-weeks | <0.001 | 0.046 | <0.001 | <0.001 | |
| 12-weeks | <0.001 | <0.001 | 0.005 | <0.001 | |
| 25-weeks | <0.001 | 0.024 | 0.019 | <0.001 | |
| Lateral | 3-weeks | 0.223 | 0.013 | 0.346 | |
| 8-weeks | 0.029 | 0.482 | <0.001 | ||
| 12-weeks | 0.037 | <0.001 | <0.001 | ||
| 25-weeks | 0.006 | <0.001 | 0.006 |
Secondary Statistics
Wilcoxon signed-rank test (Table 6) shows that the 3-week meniscal damage scores were significantly different than tibial damage scores for all inter-time point comparisons, except when comparing 3-week meniscus with 8-, 12-, and 25-week tibia.
| Tibia | |||||
|---|---|---|---|---|---|
| 3-week | 8-week | 12-week | 25-week | ||
| Meniscus | 3-week | 0.002 | 0.914 | 0.925 | 0.159 |
| 8-week | <0.001 | <0.001 | <0.001 | <0.001 | |
| 12-week | <0.001 | 0.016 | <0.001 | <0.001 | |
| 25-week | <0.001 | <0.001 | <0.001 | <0.001 | |
DISCUSSION
Tissue degradation in primary OA is a slowly progressive and variable process, spanning over a long period of time (at least many years) in humans, and the initial events are rarely observed. In surgically induced OA, the tissue damage can be monitored more precisely as a function of time to study the effects of joint instability. In both human clinical OA and canine experimental OA, attempts to classify this continuous and variable process into a finite set of disease stages (using a manageable set of integers) involves simplification and generalization of a complex process, and is criteria-dependent and subjective. However, such scoring systems are useful in both research and clinical practice, since it attempts to assess the severity of the disease among different groups of researchers and physicians, and from physicians to patients.
Observations and Changes to Scoring Criteria
We began this analysis by adapting several known cartilage scoring methods [5, 13, 14] and analysis descriptions [11, 23, 24]. However, we soon noticed additional differences among our control and 3-week specimens such as structural deformation and discoloration. In general, scoring primarily focuses on tissue damage and lesions. Yet, in an osteoarthritic joint, fibrillation, lesions, and tears are not the only visible damage to cartilaginous joint components, and additional criteria could be considered in scoring. This is especially important for damage indicators that present before lesions and tears: in particular, discoloration and deformation. The cause of discoloration is unknown, but may be due to hemosiderin deposition [23] originating from vascular leakage of the inflamed synovium, or iron deposition resulting from surgery [21]. No matter the origin, cartilage damage can result from a single occurrence of intraarticular bleeding [22]. Therefore, our initial observations indicated discoloration as a likely identifiable precursor of the accepted damage features described in the literature, for this animal model.
The addition of deformation criterion was also an important aspect since, 1) the small anterior meniscal projection of one control sample, which elicits a score of 0 by standard grading schemes, had induced a tibial cartilage lesion; and 2) discoid menisci, although not uncommon [25], are known to present with increased occurrence of tearing [26], and in the present study showed signs of increased striation and material (collagen) spreading. If only tears were to be assessed for grades, those menisci would elicit a score of 0. After considering these arguments, our grading scale remained similar to the OARSI [5], Outerbridge [13], and Mastberger [14] scores, but was slightly modified to include discoloration and deformation elicited a minimum score of 1. It cannot be overly stated that this change in scoring criteria was not intended to create a new scoring system. The added criteria made only a small adjustment to the established protocol in order to accommodate our initial observations, and made only a partial shift from score 0 to score 1.
Meniscus Induced Damage
Early onset meniscal damage has been similarly reported in the literature [27]. Damage originating posteriorly is likely due to the direction of movement allowed when the anterior cruciate ligament (ACL) is unattached and the posterior cruciate ligament (PCL) remains attached. The ACL limits forward sliding of the tibia, with respect to the femur, and lack of such will cause major friction and loading forces to be directed sagitally and posteriorly [28-30]. Also, there would be reduced force between the tibial and femoral anterior aspects, since ACL deficiency would allow anterior joint separation. The degenerative process seen affecting the whole meniscus (as seen at 25-weeks) after destabilization may be from two events: 1) there may be friction and loading forces affecting the entire surface plane, although reduced compared to the posterior aspect, and 2) bone and tissue remodeling can redirect forces, causing homogenous damage across the whole surface [2, 31].
Although the meniscus tends to protect the articular cartilage (AC) from damage, once the meniscus is torn it can act as a loose body between the femoral head and tibial plateau. The loose meniscal flaps may grind into the AC causing lesions. The absence of posterior lesions at 25-weeks may be due to complete degeneration of the meniscus, which allowed for repair activity, possibly hypertrophic repair [1, 2, 7, 8].
Previous studies showed the damage severity to the meniscus does not coincide with the level of damage to the tibial and femoral condyles [24, 35]. Statistically, we have concluded a similar finding for later stage time-points, but we have also found there to be correlation of 3-week medial meniscal damage to the 8-week (and later) ACLT tibial damage. Although this supports the idea the meniscus tends to protect the articular surfaces [15, 28, 36], it appears the protection occurs only for the very beginning stages of OA (around 3-weeks), and is location dependent (meniscus-covered or uncovered). In addition, our unblinded assessment has shown that as time progresses, the loose meniscal body that occurred posteriorly damaged the AC. Similarly, the differing extent of damage between the covered and uncovered region of the medial ACLT tibial condyles can be explained by the loose body. If the loose body of a posterior meniscal tear is between the femur and tibia it may generate friction and ‘dig’ into the AC. The posterior aspect exhibited the worst and longest lasting lesions due to the direction of freedom allowed by ACLT and since the meniscus does not become fully degenerative until about 12- to 25-weeks, respectively. Once full degeneration of the meniscus occurs, the AC can undergo repair. A loose body may not severely affect the uncovered region, therefore, healing (tissue growth, hypertrophy, etc.) can begin at an earlier stage.
A major benefit is the documentation of post-surgical time-points, that when combined with an integer based scoring system, allows a numerical depiction of OA progression. In practice, a higher score indicates a greater damage, or a tissue in a worse condition; in contrast, we see a reduction in the tibial and femoral scores after 8-weeks post-operative. Currently, we cannot claim the later-stage tibia and femoral group to be more ‘healthy’ since it is likely that visible damage is obscured by hypertrophic repair, and it is unknown if this hypertrophic tissue is biomechanically and biochemically adequate to withstand normal joint usage.
Biomarkers
The search for early-stage OA biomarkers is a current and active topic in arthritis research, and identification could result in early diagnosis or may lead to advanced treatments. There are two readily identifiable gross anatomical biomarkers observed in this gross-anatomical study. First, ACLT patella scores suggest damage occurs soon after ACL transection. The small variation of same time-point groups (except for the one 12-week outlier) indicates consistent patellar damage. Therefore, patella may provide a good subject for early anatomical biomarker study of OA. Second, intercondylar eminence tissue growth was a prominent and consistent reaction to ACLT. This tissue could provide insight into tissue growth factors, which could lead to future OA treatments.
Clinical Relevance - Meniscectomy
The benefits and disadvantages of meniscectomy are subject for debate, as studies have shown the negative effects of partial and complete meniscectomy [32, 33]. Although in recent years, sutured repair has been implemented and produced positive results [34], our present study has shown that naturally deformed menisci can cause cartilage damage. It may be, that minor surgical remodeling of abnormally shaped menisci could prevent cartilaginous damage and might be an appropriate approach if joint pain or cartilaginous damage is present. Similarly, the coincidence of meniscal and cartilage damage suggests that meniscectomy may be a necessary procedure when surgical (e.g., sutured) repair is not an option. This study also adds support to recent clinical findings concerning the lack of benefit for arthroscopic meniscectomy of degenerative meniscal tears [33]. The menisci in this study showed cartilage repair activity occurred after the meniscus became degenerative since the loose meniscal body was no longer able to antagonize cartilage lesions.
Clinical Relevance - Arthroscopy
Similar to this study, arthroscopic assessment of OA, a gold-standard of clinical diagnosis [37, 38], is limited to surface observations. However, arthroscopic assessment is additionally limited to a small region of the knee surface since there are portions under the meniscus that cannot be visualized. Our assessment, in contrast, includes the meniscus-covered region, which can provide additional insight into damage occurring at a typically non-viewable region, in conjunction with the standard assessment region. By studying the surface damage of the whole joint as well as other measures of the osteoarthritis pathology, the findings in this type of animal study might help to predict hidden lesions that cannot be observed through arthroscopy.
LIMITATIONS
During dissection of two stifles, scalpel cuts were made on 1 femur, 1 meniscus, and 3 patellae. The scalpel marks were accidental, and easily identified in the images. We were able to classify those damaged structures and remove them from scoring analysis.
This study focused on the gross-anatomical assessment of the canine stifle and did not include a histological component. Therefore, this study verifies tissue growth, remodeling, and defect filling, but cannot verify microstructural changes, such as cellular hyperplasia, that promote the macrostructural changes. But, gross anatomical assessment is an important tool for understanding the broad pathological changes in osteoarthritis, and macroscopic alteration are routinely evaluated for animal models [39-41]. Furthermore, hypertrophic repair activity and cartilaginous defect filling are well-known occurrences in canine AC, so we assume it to play some role in the gross anatomical observations.
In macroscopic assessment, India ink staining is recommended [5] to amplify the visibility of damages. We did not perform these additional procedures since the specimens were to be used in several other highly sensitive tests, which could be disrupted by tissue staining. Some additional studies are ongoing that include other forms of assessment, including polarized light microscopy [42], histology [20], or high-resolution MRI [15, 16, 43], to fully understand the interstitial variation in the OA time-point groups. Even though only macroscopic assessment was performed, this study shows the large variation within several OA groups. Additional measures by complementary technology [16, 19, 20, 42, 44, 45] might shed more light on the interstitial and molecular properties.
CONCLUSION
This study provides an additional perspective to the animal models of early-stage OA currently provided by the literature, and has identified meniscus induced damage and the macroscopic process of OA and joint repair. To the best of our knowledge, a correlation between meniscal and cartilaginous damage has not been readily identified, and the gross-anatomical changes of the canine knee joint has not been studied and presented in such a way as to show the early stage gross anatomical progression and relate it to scoring. The documentation of post-surgical time points has allowed us to see that meniscal damage occurred first, and loose meniscal bodies may have induced the cartilage lesions through several weeks following meniscal tearing. After the meniscus was greatly degenerated, defect filling appeared to have occurred. Defect filling obscured much of the macroscopic damage, and cartilage scores decreased or plateaued. These findings indicate a possible inaccuracy in cartilage health diagnostics, but comparisons between human and animal cartilage repair activity is largely lacking in the literature. It may be that cartilage defects repair differently or less than in human than in canine. Finally, these findings provide additional information for decisions concerning partial meniscectomy and meniscal repair, and a possible benefit of reshaping procedures of deformed menisci.
CONFLICT OF INTEREST
The authors confirm that this article content has no conflict of interest.
ACKNOWLEDGEMENTS
The authors thank the National Institutes of Health for providing the R01 grant (AR 052353; PI: Y.X.).