All published articles of this journal are available on ScienceDirect.

Intrarater and Interrater Reliability of the Socket Version Marker in Total Hip Replacement
Authors Info & Affiliations
Abstract
The aim of this study was to evaluate the intraobserver and interobserver variability in determining the socket version using the wire marker. 100 anteroposterior pelvis radiographs of cemented primary total hip replacements were reviewed by two orthopaedic consultants and registrars, twice. Intrarater and interrater reliability were assessed using Cohen’s kappa. Intrarater kappas for junior doctors were 0.78 and 0.80, 0.73 and 0.62 for Consultants. Interrater kappas were 0.60 between the two Consultants and 0.63 between the two Junior Doctors. The kappas between Consultant A and Junior Doctor A was 0.61, between Consultant A and Junior Doctor B was 0.59, between Consultant B and Junior Doctor A was 0.53 and between Consultant B and Junior Doctor B was 0.46. Intrarater reliability was substantial for the two junior doctors and the two consultants. Interrater reliability was moderate-to-substantial between the two consultants, between the two junior doctors and between each pair of junior doctors/consultants.
INTRODUCTION
Orientation of the socket is important in total hip arthroplasties. Orientation includes inclination and version. In the earliest stages of the evolution of the Charnley low-friction arthroplasty, the socket had no wire marker [1]. As arthroplasty evolved, wire marker was added to the socket in cemented total hip replacements (THR). Concentric and radial grooves were made on the posterior aspect of the socket to seat the wires. A single wire bent at 90 degrees is placed in the grooves; one semicircular wire to indicate wear called wear marker, is placed over the summit of the socket coronally, this wire is then continued over the anterior margin of the socket at right angles to the wear marker as the version marker. Thus, with the socket in neutral position, i.e., with its face exactly in line of the x-ray beam, the appearance is that of the wear marker as a semicircle while the anteversion marker forms a straight line resembling string of a bow at rest (Fig. 1). The anteversion marker will appear curved towards the wear marker when the socket is anteverted (Fig. 2) in other words curved upwards or convex upwards and away from it when the socket is retroverted (Fig. 3) in other words curved downwards or convex downwards [2].
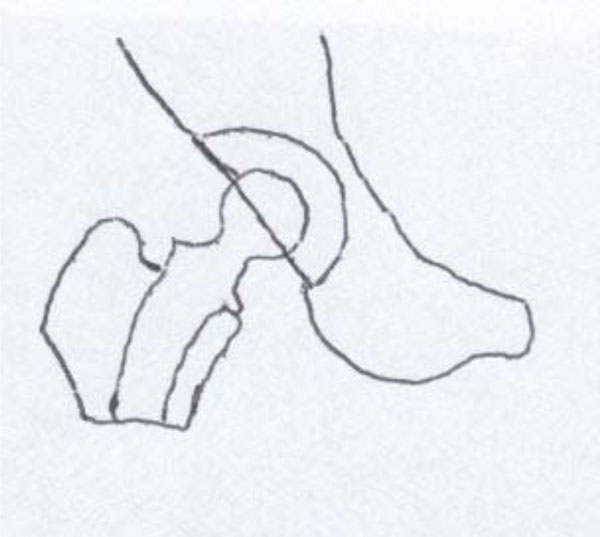
Neutral cup (Wire marker straight line).
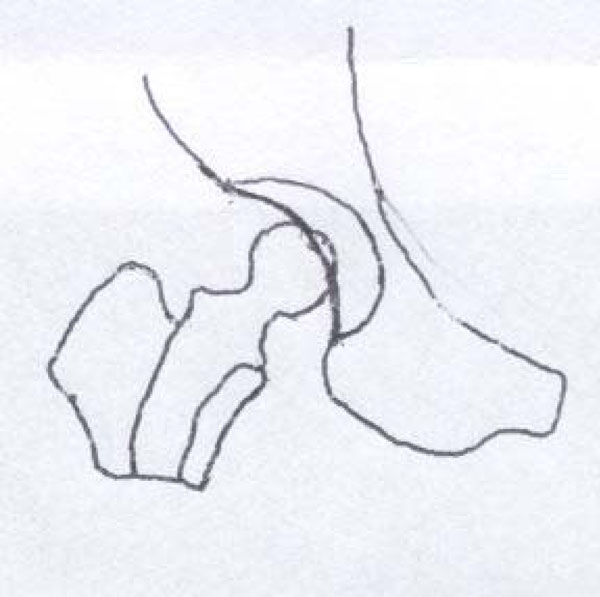
Anteverted cup (Wire marker convex upwards).

Retroverted cup (Wire marker convex downwards).
The lack of consistency of much medical judgement and decision making has long been appreciated. This is an important source of error as version of the cup is important for the stability of a hip replacement and/or impingement
and any error in determining cup version will have implications on decision making. Variability in recordings may arise from two sources. A lack of consistency within an individual observer also known as intraobserver variability and/or a lack of agreement between observers also known as interobserver variability. The aim of this study was to evaluate the intraobserver and interobserver variability in determining the socket version using the wire marker.
MATERIAL & METHODS
The aim of this study was to evaluate the intraobserver and interobserver variability in determining the socket version using the wire marker. 100 anteroposterior pelvis x-rays in 100 cemented THR were reviewed. The radiographs were randomly chosen the essential inclusion criterion was that they had to be primary cemented THR. The radiographs were reviewed by two orthopaedic consultants with special interest in arthroplasty and two orthopaedic registrars (junior doctors), on two different occasions. The inclusion criterion for the consultant was that they had to have special interest in lower limb arthroplasty and the junior doctors were chosen randomly. The two occasions were at least two weeks apart to limit the effect of memory. The findings were recorded by the author on each occasion. The raters had the option of choosing one of the four options for each x-ray. The options were anteversion where the version marker wire is convex upwards, retroversion where version marker wire is convex downwards, neutral where the version marker is seen as a straight line and cannot say. Intraobserver and interobserver variations were calculated using the data. The method of administration to all the raters on each occasion was identical. The hundred x-rays were shown to them on a computer screen in a sequential order with the rater seated comfortably on a chair at a distance, which was comfortable for him to see the screen. The second observation was at least two weeks after the first so that memory does not bias the findings, and the same set of x-rays were again shown to be interpreted in the same setting. The rater was blinded to the results of the first occasion. The findings were on each occasion recorded by the author on an A4 size paper with serial numbers 1 to 100 for the 100 radiographs used. Eight such sheets were used for the eight different occasions. These findings were recorded. The data were later transferred to Microsoft excel sheet. Anteversion was coded number 1; neutral was coded number 2; retroversion was given number 3; cannot say was coded number 4.
For testing inter-rater reliability a repeated measures design is recommended [3, 4, and 5]. A repeated measures design was used in this study. Peat and Barton have recommended the following rules for a study measuring repeatability [5]. The method of administration must be identical on each occasion. At the second administration, both the participant and the rater must have no knowledge of the results of the first measurement. The time to the second administration should be short enough so that the condition has not changed since the first administration (This condition does not apply to this study). The time between administrations must be long enough for participants to have forgotten their previous responses, and the setting in which the repeatability is established must be the same as the setting in which the measurement will be used. As explained previously, these rules were adhered to in this particular study. They also recommend that kappa is used to test the agreement between observers or between administrations for both binary and nominal (categorical) scales.
Sample Size
Donner and Eliasziw [6] have given power contours for reliability studies. According to their study, with the number of repeats (n) kept constant, if the number of subjects are increased (k) (x-rays in this study), the power progressively increases till a threshold of k is reached beyond which any increase in k brings very little return. They also suggest that the required value of n for a given k increases very rapidly as k declines. As per their chart, to demonstrate a reliability coefficient of 0.8 with two repeats, as in this study, a minimum of 50 subjects (x-rays) are required to achieve a power of 95%. We chose 100 x-rays, so that a high power is achieved and also to make calculations easier.
Statistics
Repeatability is a measure of the consistency of a method. Kappa coefficient was used in this study to measure the level of agreement between raters. Kappa is calculated by subtracting the chance proportion of agreement from the observed proportion of agreement and dividing this value by a number which is one less than the chance proportion of agreement. The values for kappa usually lie between zero and 1; zero indicates no correlation better than chance agreement and 1 indicates perfect agreement. There is no value of kappa that can be regarded universally as indicating good agreement, and that acceptable agreement depends upon the circumstances [7]. Landis and Koch [8] suggested the interpretation of kappa given in Table 1 which was followed in this study.
Landis and Koch’s Interpretation of Kappa
| Value | Interpretation |
|---|---|
| Below 0.0 | Poor |
| 0.00-0.20 | Slight |
| 0.21-0.40 | Fair |
| 0.41-0.60 | Moderate |
| 0.61-0.80 | Substantial |
| 0.81-1.00 | Almost perfect |
RESULTS
Frequency tables were constructed for all the responses Tables 2 and 3. Intrarater reliability for each rater, interrater reliability between each consultant and the junior doctor pair, and the interrater reliability between the two junior doctors were calculated.
Overall Frequency of Ratings
| Grade | Frequency | Percent |
|---|---|---|
| 1 (anteversion) | 646 | 80.75 |
| 2 (neutral) | 126 | 15.75 |
| 3 (retroversion) | 27 | 3.38 |
| 4 (cannot say) | 1 | 0.13 |
| Total | 800 | 100.00 |
Frequency of Ratings by Doctor and Rating
| CA1 | CA2 | CB1 | CB2 | JDA1 | JDA2 | JDB1 | JDB2 | Total | |
|---|---|---|---|---|---|---|---|---|---|
| 1 (anteversion) | 81 | 78 | 88 | 92 | 78 | 83 | 74 | 72 | 646 |
| 2 (neutral) | 16 | 19 | 7 | 5 | 19 | 14 | 21 | 25 | 126 |
| 3 (retroversion) | 3 | 3 | 4 | 3 | 3 | 3 | 5 | 3 | 27 |
| 4 (cannot say) | 0 | 0 | 1 | 0 | 0 | 0 | 0 | 0 | 1 |
| Total | 100 | 100 | 100 | 100 | 100 | 100 | 100 | 100 | 800 |
| CA1 | CA2 | CB1 | CB2 | JDA1 | JDA2 | JDB1 | JDB2 | Total | |
| 1 (anteversion) | 81 | 78 | 88 | 92 | 78 | 83 | 74 | 72 | 646 |
| 2 (neutral) | 16 | 19 | 7 | 5 | 19 | 14 | 21 | 25 | 126 |
| 3 (retroversion) | 3 | 3 | 4 | 3 | 3 | 3 | 5 | 3 | 27 |
| 4 (cannot say) | 0 | 0 | 1 | 0 | 0 | 0 | 0 | 0 | 1 |
| Total | 100 | 100 | 100 | 100 | 100 | 100 | 100 | 100 | 800 |
Abbreviations: CA1- Consultant A 1st rating; CA2- Consultant A 2nd rating; CB1- Consultant B 1st rating; CB2- Consultant B 2nd rating; JDA1- Junior doctor A 1st rating; JDA2- Junior doctor A 2nd rating; JDB1- Junior doctor B 1st rating; JDB2- Junior doctor B 2nd rating.
There was some variability in the relative proportions allocated to each category between doctors; Consultant B rated 180 (90%) as ‘anteversion’ and only 12 (6%) as ‘neutral,’ whereas at the other extreme, Junior Doctor B rated 146 (73%) as ‘anteversion’ and 46 (23%) as ‘neutral.’
Intrarater kappas for junior doctors were: 0.78 (95% Confidence Interval [CI] 0.60 to 0.92) for Doctor A and 0.80 (95% CI 0.67 to 0.92) for Doctor B. For Consultants, the kappa values for intrarater reliability were 0.73 (95% CI 0.54 to 0.88) for Consultant A and 0.62 (95% CI 0.33 to 0.85) for Consultant B.
To calculate the interrater reliability between junior doctors and consultants the response on the first occasion was taken into account. Interrater reliability kappas were: 0.60 (95% CI 0.38 to 0.79) between the two Consultants and 0.63 (95% CI 0.45 to 0.79) between the two Junior Doctors (Table 4).
Pairwise Kappa Coefficients (95% Confidence Interval) Between Doctors; Diagonal Entries are Intra-Rater Coefficients; Off-Diagonal Entries are Inter-Rater Coefficients
| CA | CB | JDA | JDB | |
|---|---|---|---|---|
| CA | 0.73 (0.54 to 0.88) | 0.60 (0.38 to 0.79) | 0.61 (0.40 to 0.79) | 0.59 (0.40 to 0.76) |
| CB | 0.62 (0.33 to 0.85) | 0.53 (0.32 to 0.73) | 0.46 (0.26 to 0.65) | |
| JDA | 0.78 (0.60 to 0.92) | 0.63 (0.45 to 0.79) | ||
| JDB | 0.80 (0.67 to 0.92) |
DISCUSSION
In this study, a total of 800 responses were obtained from the 4 participants. As mentioned earlier, the respondents had to choose from one of the four options given to them, which were anteversion, neutral, retroversion, and cannot say. Of the 800 ratings, 646 (80.8%) were of ‘anteversion’. When one particular response forms the majority, the respondent’s answers being correct by chance are higher. On further analyzing the results, this bias towards anteversion becomes clearer. Consultant ‘A’ responded as anteversion 81 (81%) times on the first occasion and 78 (78%) on the second occasion. Consultant ‘B’s’ tally of anteversion as the answer was 88 (88%) and 92 (92%) respectively. The two Junior Doctors responded as anteversion 78%, 83% and 74%, 72% respectively. The difference between the first and the second responses is not more than 3%. This means that when it came to identifying anteverted cups on the x-rays, all the four observers correctly identified it, more often than not. The second highest number of responses belonged to the neutral category. Totally, 126 (15.8%) responses came under this category. The numbers for the individual observers are as follows: 16%, 19% for Consultant ‘A,’ 7%, 5% for Consultant ‘B,’ 19%, 14% for the first Junior Doctor, and 21%, 25% for the second Junior Doctor. The chances of the individual observers erring on this response appear to be higher compared to anteversion. The third most frequent response was retroversion 27 (3.4%) responses. Overall, from the responses, it is clear that the majority of the x-rays studied belonged to the category of anteversion. This is due to the fact that, in clinical practice, the operating surgeon strives to consciously place the acetabular cup in an anteverted position. The neutral and the retroverted cups are usually the result of error in judgement and are not intended. The observer is also aware that the cup should normally be anteverted, whether this gives rise to bias is difficult to say. The best intrarater kappa value was 0.80 in JDB.
The other aspect that needs discussion is that of confidence interval. The 95% confidence interval for the four raters in the intraobserver reliability were (0.54 to 0.88), (0.33 to 0.85), (0.60 to 0.92), and (0.67 to 0.92) respectively for Consultant A, Consultant B, Junior Doctor A, and Junior Doctor B respectively. The 95% confidence intervals in kappa statistics are useful when they are narrow. The confidence interval obtained for the intraobserver reliability in this study are wide and do not add any further information to the kappa values obtained. The confidence intervals for the interobserver variability were (0.38 to 0.79) between Consultant A and Consultant B, (0.40 to 0.79) between Consultant A and Junior Doctor A, (0.40 to 0.76) between Consultant A and Junior Doctor B, (0.32 to 0.73) between Consultant B and Junior Doctor A, and (0.26 to 0.65) between Consultant B and Junior Doctor B. These values are again very wide and add no significant additional information to the kappa value.
The next aspect which needs discussion is that of the strengths and weaknesses of this study. There are several strengths of this study; a high number of radiographs were used to increase the power of the study. The other strengths are that the method of administration to all the raters on each occasion was identical and the raters were blinded to the responses given on the first occasion. As mentioned earlier a high percentage of radiographs belonged to the category of anteversion and this can give rise to bias, this can be considered as a limitation of this study. The second reading of the raters was taken at least two weeks after the first reading which reduced the effect of memory and the raters were also blinded, thereby partially negating bias
Various methods have been proposed to measure the angle of anteversion of an acetabular cup. In the clinical setting, the easiest way to know the socket version on postoperative AP x-ray of pelvis is by wire markers. Wroblewski [2] described a novel technique of incorporating two semi-circular wires within the prosthetic cup to determine wear and version of the cup. Though this is an easy and a convenient method, it cannot measure the exact version angle. There are no published reports in English literature, which have looked at the interrater and the intrarater reliability of determining socket version using these wires. The study was aimed at achieving the above-mentioned goal. The results have sprung up a few surprises. One would think that identifying the direction in which a wire is facing should not be very difficult to the naked eye, but in this study, there was no unanimity in identifying socket version within or between observers. The best kappa value achieved was 0.80 for Junior Doctor A.
Widmer and Ing [9] described a method to measure the version using the circular opening of the cup, which is projected as an ellipse on the true anteroposterior radiograph of the pelvis. They calculated the ratio of the short axis of the ellipse and the total length of the projected cross section of the cup; this ratio is tabulated versus cup anteversion. There is no published material in English language literature, which has looked at the interrater and intrarater reliability of Widmer and Ing’s method, but once the ratio is accurately calculated, the angle of version is given by a table which takes out the interrater and intrarater reliability factor.
Markel et al. [10] described a technique of approximately assessing version of the acetabular cup without the use of formulae. Their technique is based on obtaining 2 radiographs at different angles to roughly estimate the version.
Hassan et al. [11] have also described a mathematical formula, which is similar to that of Ackland et al. [12] to calculate version of the acetabular cup. This formula, again, is based on the mathematical principles of ellipse and utilizes lines drawn on the radiograph. Two x-rays are needed to differentiate between anteversion and retroversion. The unique aspect of the paper is that they have tested the intraobserver reliability for this formula in the paper. Measurements were made by five orthopaedic surgeons on two different occasions to determine the degree of version. Intraclass correlation coefficient was used to determine the reliability amongst the observers. They concluded that there was a tendency to underestimate the known version. The intraobserver agreement was very high with the intraclass correlation coefficient being between 0.97 and 0.99 for all the observers. They concluded that there was a systematic pattern of underestimating the known version, which was most likely due to difficulty in identifying the apex of the ellipse. They suggest using sophisticated measuring devices, which can minimize the error. They also concluded that acetabular cup version can be calculated reasonably accurately using their formula. They, however, have not commented on interobserver agreement, and this is a downside of this paper.
Liaw et al. [13] have designed a protractor to measure the true and planar anteversions in postoperative radiographs. The crucial step in this method would be to identify the correct points on the ellipse so that an accurate measurement can be made. The authors do agree that it is not always easy to correctly identify these points. So, it would be fair to assume that this would give rise to significant interobserver and intraobserver differences in the measurement. This has not been investigated.
Liaw et al. [14] studied 2 methods of measuring acetabular cup anteversion and compared the results in 336 radiographs. They compared the trigonometric method described by Liaw [13] and the protractor method described by Widmer [9]. They measured the range of error between the above-mentioned methods. They found the range of error by Widmer’s protractor to be more than twice the range of error measured by Liaw’s modified protractor, which was found to be statistically significant. They concluded that the radiographic measurement of anteversion is imprecise, as several variables such as patient position, radiographic magnification, and observer errors are involved.
Wroblewski wire markers are more user friendly and practical. This can be used in day-to-day practice. There are no complicated formulae to be used, and a single pelvis x-ray can differentiate anteversion from retroversion. The downside of the wire marker, as shown in this study, is that it is subject to significant interrater and intrarater observation errors. A cup, which has a high degree of either anteversion or retroversion, will be very clearly made out on the x-rays, as the version marker wire will be very clearly curved upwards or downwards, as the version may be, and this is unlikely to give rise to observation errors. On the contrary, a cup which is only marginally retroverted or anteverted could give rise to significant observation errors, as the curvature of the wire on the x-ray is not pronounced, and the observers can err in their judgment, as to which way the cup is directed. This can explain a significant interobserver and intraobserver differences in agreement in this study. The results could have been biased based on the type of x-rays that were chosen for the observers to comment. If the x-rays predominantly included those cups with high degrees of either ante or retroversion, the agreement could have been significantly better. Another study comparing marginally anterverted/retroverted cups with high-degree anteverted/ retroverted cups can further address this issue.
CONCLUSION
Overall, based on Landis and Koch [8] interpretation of kappa the following conclusions have been made. Intrarater reliability was substantial for each of the two junior doctors and each of the two consultants. Interrater reliability was moderate-to-substantial between the two consultants, between the two junior doctors and between each pair of junior doctors/each pair of consultants.
The wire marker is an easy and cost effective method to detect the version of the prosthetic cup. High display quality and radiologic techniques, via adequate and reproducible positioning of the patient, continue to be the basis of a precise evaluation of the acetabular cup position. X-ray is still the most widely used method to assess the cup position in routine postoperative period following THR. As standard radiographs are easily accessible and relatively easy to evaluate, they will not lose significance in the future.
CONFLICT OF INTEREST
The authors confirm that this article content has no conflict of interest.
ACKNOWLEDGEMENTS
Declared none.