All published articles of this journal are available on ScienceDirect.

Clinical and Biomechanical Evaluations of Staged Bilateral Total Knee Arthroplasty Patients with Two Different Implant Designs
Authors Info & Affiliations
Abstract
Background:
Various implants of total knee arthroplasty (TKA) are used in clinical practice and each presents specific design characteristics. No implant managed this day to reproduce perfectly the biomechanics of the natural knee during gait.
Objectives:
We therefore asked whether (1) differences in tridimensional (3D) kinematic data during gait could be observed in two different designs of TKA on the same patients, (2) if those gait kinematic data are comparable with those of asymptomatic knees and (3) if difference in clinical subjective scores can be observed between the two TKA designs on the same patient.
Methods:
We performed knee kinematic analysis on 15 patients (30 TKAs) with two different TKA implant designs (Nexgen, Zimmer and Triathlon, Stryker) on each knee and on 25 asymptomatic subjects (35 knees). Clinical evaluation included range of motion, weight bearing radiographs, questionnaire of joint perception, KOOS, WOMAC and SF-12.
Results:
Comparison between TKAs and asymptomatic knees revealed that asymptomatic knees had significantly less knee flexion at initial contact (p < 0.04) and more flexion for most of the swing phase (p between 0.004 and 0.04). Asymptomatic knees also had less varus at loading response, during stance phase and during most of the swing phase (p between 0.001 - 0.05). Transverse plane analysis showed a tendency for asymptomatic knees to be more in internal rotation during stance phase (p 0.02 - 0.04). Comparing both TKA designs, NexgenTM implant had significantly more flexion at the end of swing phase (p = 0.04) compared to knees with the TriathlonTM implant. In frontal plane, from initial contact to maximum mid stance angle and between the mean mid stance angle and initial contact NexgenTM TKA had significantly more adduction (varus, p =0.02 – 0.03). Clinical scores of both TKAs did not have significant difference.
Conclusions:
TKA with the tested implants did not reproduce natural knee kinematics during gait. In our cohort of patients, TKA implant design translated in limited kinematics differences during gait and on clinical results.
1. INTRODUCTION
The complex knee kinematics during gait and deep knee flexion has been thoroughly studied using 3D gait analysis [1-4], dynamic fluoroscopy [5] and MRI [6-10]. In general, authors agree that knee flexion is accompanied in the transverse plane by a greater posterior translation of the lateral femoral condyle compared to the medial condyle resulting in a femoral external rotation around a medial pivot [5, 7, 8, 10]. In contrast, some studies have reported kinematics with greater posterior translation of the medial condyle resulting in a lateral pivot during flexion and gait while other studies reported gait patterns with no pivot [5, 11].The understanding of the kinematics of the natural knee led to the conception of new TKA implant designs trying to reproduce it.
Literature on kinematic analysis during gait of subjects following TKA mostly reported sagittal plane analysis and showed decrease of total range of motion during the gait cycle compared with asymptomatic knees [12-17]. Frontal plane analysis has shown controversial results where some studies reported no difference in the maximal adduction (varus) during stance and swing [15, 18, 19] while others showed increased maximal adduction [20] or a progression of maximal adduction between 6 and 12 months post-operatively [21]. Literature on the transverse plane is scarce and suggests that TKA was more in external rotation throughout gait cycle and that it had less total range of motion in that plane [15]. To our knowledge, only one study [22] compared the kinematics of two different designs of TKA in the same patient. The authors reported the kinematics in the sagittal plane of five patients with staged TKA with a semi constrained prosthesis in a knee and a mobile bearing prosthesis in the contralateral knee. Their analysis showed a marked asymmetry in gait pattern in four of their subjects with side-to-side difference of peak knee flexion up to 15o that was not clearly related to one type of prosthesis.
Total knee arthroplasties are recognized as efficient and effective procedures in terms of pain relief and improved function in patients with severe osteoarthritis [23]. Despite the decrease in pain and improved function, patients with TKA still experience residual functional difficulties and do not reach the same level of activity compared to other individuals of the same age, especially for biomechanically demanding activities such as squatting, carrying loads and gardening [24, 25]. It was also demonstrated that the clinical and functional outcomes and patient satisfaction are better after total hip arthroplasty (THA) compared to TKA [26, 27]. A possible explanation for those results is that implants are not able to reproduce the kinematics of the natural healthy asymptomatic knee during gait.
The purposes of the study were to compare sagittal, frontal and transverse knee kinematics in TKA with asymptomatic knees. And assess gait kinematics patterns between two different TKA implant designs on the same patient. And finally, verify if difference in clinical and subjective scores can be observed between the two knees with different TKA implants.
2. MATERIALS AND METHODS
2.1. Patients
The cohort of patients included 15 patients with bilateral TKA. All patients had first a traditional TKA surgery done on their most symptomatic knee using a multi radius implant design (NexgenTM, Zimmer, Warsaw, USA). Patients were clinically followed over time by their surgeon and underwent a TKA on their contralateral side when it was clinically relevant. All TKAs were performed between 2005 and 2012. During this period, there was a change of practice at the hospital in terms of the implant brand used. Therefore, all patients received another implant brand (TriathlonTM, Stryker, Mahwaw, USA) on the contralateral knee which allows a femorotibial pivot of +/-10 degrees and with a single radius femur (10-110 degrees). Four different surgeons performed the TKAs (PAV, AR, PL and DB). All patients had the same surgeon for both TKAs.The protocol was approved by the ethics and scientific committees of the hospital and all patients gave written informed consent.
For the purpose of this study, both knees were assessed at the same time. The mean follow-up time for TriathlonTM TKA was 29.2 months (range 12-46, SD 10.4) and 53.1 months (range 31-100, SD 23.2) for NexgenTM TKA. Inclusion criteria for this cohort of staged bilateral TKAs patients were a 12 months minimal follow-up after the last TKA surgery. Exclusion criteria were any complication needing TKA revision or patients with neurologic disorder altering balance and gait. The control group was composed of 25 patients (35 asymptomatic knees). They were recruited among the clinical staff and patients consulting at the orthopedic clinic for pathologies not involving the lower limb. Table 1 shows the descriptive characteristics of each group.
Descriptive characteristics of the groups.
| Descriptive characteristics | Bilateral TKA (n = 13, 26 knees) mean (range, SD) |
Asymptomatic (n = 25, 35 knees) mean (range, SD) |
p |
|---|---|---|---|
| Age (years) | 68.2 (56-88, 9.1) |
37.4 (18-70, 15.3) |
< 0.001 |
| Weight (kg) | 90.9 (68-120, 13) |
73.0 (50-103, 14.5) |
0.001 |
| Height (cm) | 166.0 (155-178, 8.1) |
172.3 (152-191, 9.7) |
0.054 |
| Body mass index (kg/m2) | 33.1 (25-44.1, 5.4) |
24.4 (18.8-32.5, 3.6) |
< 0.001 |
| Gender | 8 females 5 males |
13 females 12 males |
0.575 |
2.2. Surgical Technique
All procedures were done aiming a neutral mechanical axis with implantation of femoral and tibial components perpendicular to the mechanical axis of the femur and tibia respectively. Bone cuts and soft tissue balancing were realized to produce symmetric rectangular flexion and extension gaps. Femoral rotation was set to be parallel to the transepicondylar axis. Tibial rotation was aligned with the medial third of the tibial tuberosity and the tibial crest. All TKAs were posterostabilized and cemented. The patella was resurfaced in all cases.
2.3. Assessment
Assessment of 3D knee kinematics analysis was realized with the KneeKGTMsystem (Emovi Inc. Canada) during treadmill gait. Knee KG involves a harness designed to reduce soft tissue movement artefacts, known to impair kinematic analysis in the transverse and frontal plane. The precise measurement of bone movements is couples with a calibration procedure based on functional movements such as circumduction and flexion/extension to determine hip and knee joint centers and anatomical joint coordinate systems in a reproducible way. The systems accuracy has been assessed under fluoroscopy and within a 65o arc of motion, the system could measure knee kinematics with an average accuracy of 0.4o of knee abduction and adduction and 2.3o for axial rotation. In a different study, Hagemeister et al. [29] determined the mean repeatability of measures of kinematic measures in the frontal and transverse plane to range between 0.4o and 0.8o for knee rotation angles with ICC values ranging between 0.88 and 0.94 for knee flexion/extension, abduction/adduction, and internal/external tibial rotation respectively [28-32].
Of the 15 bilateral TKA patients, 13 (26 knees) did the gait analysis. One patient was too obese (BMI 41) to fit the knee sensor attachment system and the other had too much ankle pain to walk on the treadmill. Each patient underwent a 5 to 10 minutes walking familiarization period on the treadmill to ensure reproducible gait cycle during treadmill walking [33] before the recording of the kinematics data. the first the calibration was performed according to the functional and postural method for defining the position of the joint centers (hip, knee, ankle) and axes systems [30]. Data were then recorded during 45 seconds at comfortable gait velocity determined during the familiarization period. Dynamic joint angle data as a function of the gait cycle are presented in the form of curves over 100% of the gait cycle (100 points). The gait cycle was divided into the stance phase (0-60%) and the swing phase (60-100%) [34]. The stance phase comprised the initial contact, loading response (0-10%), mid stance (10-30%), terminal stance (30-50%) and pre-swing (50-60%) [34]. In each plane, total range of motion (ROM) and range of motion in abduction/adduction and tibial rotation at each percentage of gait were calculated and analysed separately for stance and swing. Also, in the sagittal plane, peak flexion was measured. In the frontal plane, ROM from initial contact to maximum mid stance (10-30%) angle and the amplitude between the mean mid stance angle and initial contact were calculated. The peak stance and swing angles were also calculated. Finally, in the transverse plane, peak internal rotation during stance was calculated.
Knee function was measured for patients in the bilateral TKA group with 12-Item Short-Form Health Survey (SF-12) [35], Western Ontario and McMaster Universities Arthritis Index (WOMAC) [36], Knee injury and Osteoarthritis Score (KOOS) [37] and a joint perception questionnaire [27]. Patients completed a questionnaire for each knee. Total knee range of motion (ROM) was measured with a goniometer as it is done in clinics and the mechanical axis of the lower limb was measured on long weight bearing radiographs by one of the author. Mechanical femorotibial angle was obtained in order to investigate the possible link between static frontal alignment and frontal plane kinematics. The results were expressed in terms of average, along with minimum (min) values, maximum (max) values and standard deviation (SD).
2.4. Statistical Analysis
All statistical analysis was performed using SPSS software version 19.0 (SPSS Inc, Chicago, IL, USA). Continuous variables of kinematics results, ROM, mechanical axis measurement and subjective scores were compared with paired t test for patients with bilateral TKA. The comparison of continuous independent variables of kinematics results of Nexgen, Triathlon and asymptomatic knees was performed using one-way ANOVA. Continuous variables of demographic data of the TKA and asymptomatic groups were compared with independent t test whereas Pearson’s chi-squared test was used for categorical variables. Statistical significance was set at p = 0.05. The Pearson correlation coefficient was used to test whether there was an association between the mechanical femorotibial angle and peak stance angle in the frontal plane.
3. RESULTS
Comparing asymptomatic knees with TKA, natural knees had significantly less knee flexion at initial contact (1% to 3% of gait cycle) compared to TKAs (p = 0.03 and 0.04) and more flexion for most of the swing phase (62% to 89% of gait cycle) (p between 0.004 and 0.04) (Fig. 1). Asymptomatic knees also had less varus at loading response (5 to 7% of gait cycle) (p = 0.04), during stance phase (26 to 35% and 42 to 48% of gait cycle) (p = 0.04) and during most of swing phase (60 to 97% of gait cycle) (p between 0.001 and 0.05) (Fig. 2). Peak varus angle during loading and swing phases were significantly less for asymptomatic knees (Table 2). Transverse plane analysis showed a tendency for asymptomatic knees to be more in internal rotation during stance phase compared to TKA’s with higher peak stance internal rotation (Table 2) and with significant differences between 9% and 13% of gait cycle (p between 0.02 and 0.04) (Fig. 3).
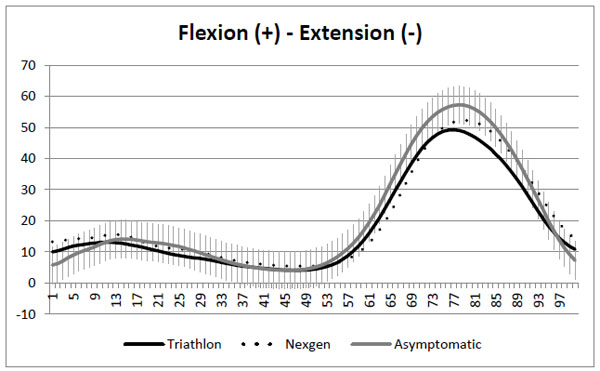
Sagittal plane kinematics. SD on asymptomatic knees curve.
When comparing both TKA designs, in sagittal plane, the knees with the NexgenTM implant had significantly more flexion at the end of swing phase between 83% and 89% of the gait cycle (p = 0.04) compared to knees with the TriathlonTM implant (Fig. 1). Total ROM, ROM during stance and swing as well as peak knee flexion was not significantly different between the two knees (Table 2). In frontal plane, ROM from initial contact to maximum mid stance (10-30%) angle and difference between the mean mid stance angle and initial contact were significantly more in adduction (varus) for NexgenTM TKA (Table 2). Transverse plane analysis showed a tendency toward more ROM for TriathlonTM, but no result was statistically different (Table 2).
Kinematic parameters results for NexgenTM TKAs, TriathlonTM TKAs and asymptomatic knees.
| TriathlonTM TKA (mean- range, SD) |
NexgenTM TKA (mean- range, SD) |
p value* | Asymptomatic knees (mean - range, SD) |
p value* | |
|---|---|---|---|---|---|
| Sagittal plane | |||||
| Total ROM (°) | 47.1 (39.1- 56.6, 6.5) |
48.2 (40.7 - 60.8, 6.0) |
0.4 | 55.4 (40.3 – 68.8, 5.3) |
0.001 |
| Stance phase ROM (°) | 15.3 (6.9 - 29.6, 5.6) |
13.6 9.2 - 23.6, 4.6) |
0.4 | 17.4 (10.6 – 25.7, 4.1) |
0.03 |
| Swing phase ROM (°) | 41.9 (30.9 - 51.0, 5.8) |
43.9 35.9 - 59.2, 6.9) |
0.1 | 51.1 (35.6 – 60.0, 5.8) |
0.001 |
| Peak knee flexion (°) | 50.4 (34.7 - 70.6, 8.4) |
52.8 (36.0 - 61.6, 8.7) |
0.3 | 57.6 (45.8 – 67.2, 4.6) |
0.003 |
| Frontal plane (positive values = varus) | |||||
| Total ROM (°) | 10.1 (4.4 - 18.7, 4.2) |
9.6 (6.1 - 18.8, 3.3) |
0.6 | 9.9 (4.6 – 19.6, 3.5) |
0.9 |
| Stance phase ROM (°) | 4.6 (2.0 - 8.3, 2.0) |
4.7 (1.7 - 7.4, 1.4) |
0.7 | 5.4 (1.3 – 13.3, 2.4) |
0.4 |
| Swing phase ROM (°) | 9.0 (4.4 - 14.6, 3.5) |
8.6 (4.9 - 16.8, 2.9) |
0.7 | 9.0 (3.3 – 17.2, 3.2) |
0.9 |
| Peak stance angle (°) | 4.9 (-3.5 - 11.5, 4.9) |
6.6 (-5.5 - 14.1, 6.1) |
0.3 | 3.4 (-1.0 – 10.2, 3.0) |
0.05 |
| Peak swing angle (°) | 9.0 (0.2 -15.3, 4.9) |
9.2 (-1.5 - 25.8, 7.3) |
0.9 | 3.6 (-2.0 – 11.5, 3.7) |
0.001 |
| ROM IC – max mid stance (°) | 0.4 (-1.4 - 2.4, 1.2) |
1.6 (-0.3 - 5.2, 2.0) |
0.03 | 1.1 (-2.0 – 3.9, 1.3) |
0.1 |
| Δ mean mid stance – IC (°) | -0.4 (-1.8 - 1.0, 1.1) |
0.8 (-1.3 - 4.7, 2.0) |
0.02 | 0.3 (-3.2 – 2.4, 1.4) |
0.1 |
| Transverse plane (positive values = external tibial rotation) | |||||
| Total ROM (°) | 12.7 (6.5 - 27.5, 5.6) |
10.9 (5.5 - 15.0, 3.1) |
0.2 | 12.6 (7.3 – 29.6, 4.8) |
0.5 |
| Stance phase ROM (°) | 8.5 (3.4 - 22.8, 4.9) |
6.7 (3.5 - 12.4, 3.2) |
0.2 | 8.9 (4.1 – 17.8, 3.3) |
0.2 |
| Swing phase ROM (°) | 11.8 (5.7 - 27.5, 6.0) |
10.1 (5.4 - 14.3, 3.3) |
0.2 | 10.9 (3.4 – 26.4 , 4.6) |
0.6 |
| Peak stance internal rotation (°) | 2.9 (-5.0 – 14.4, 5.1) |
1.9 (-3.4 – 11.7, 4.3) |
0.6 | 4.5 (0.5 – 15.3,3.1) |
0.1 |
* paired t test TriathlonTMvs NexgenTM
* one-way ANOVA TriathlonTMvs NexgenTMvs asymptomatic knees
No statistical differences were observed between TriathlonTMTKA’s and NexgenTMTKA’s in clinical scores. WOMAC global score was 19.5 (0 - 56, 21) for TriathlonTM and 17.1 (1 - 35, 17.7) for NexgenTM (p = 0.49). SF-12 physical health score was 44.0 (20 - 55, 9.2) for TriathlonTM and 43.1 (20 - 55, 9) for NexgenTM (p = 0.2) and the mental health score was 55.4 (43 - 69, 7.9) for TriathlonTM and 55.7 (43 - 69, 7.9) for NexgenTM (p = 0.6). Table 3 and 4 show results for the KOOS and joint perception questionnaire respectively. Most of the patients for both TKAs felt like they had an artificial joint with minimal restriction. Seven patients felt they had a better result and function with the TriathlonTM TKA, 5 with the NexgenTM TKA and 3 had no preference. Mean flexion was 122.7o (100 - 130, 8.8) for TriathlonTM and 119.6o (100 -130, 9.7) for NexgenTM (p = 0.08). All TKAs had a full extension. Mean mechanical tibiofemoral angle was 1.2ovarus (3.0ovarus - 2.4o valgus, 1.6) for TriathlonTM and 2.0ovarus (6.5ovarus - 2.1o valgus, 2.5) for NexgenTM (p = 0.24). The Pearson correlation coefficient between the mechanical tibiofemoral angle and the peak stance angle in the frontal plane was 0.286 was TriathlonTM and 0.324 for NexgenTM.
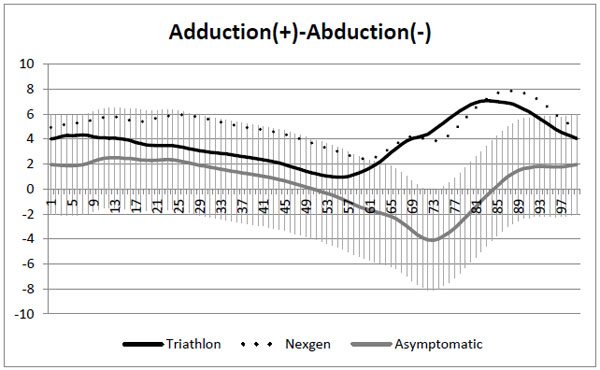
Frontal plane kinematics. SD on asymptomatic knees curve.
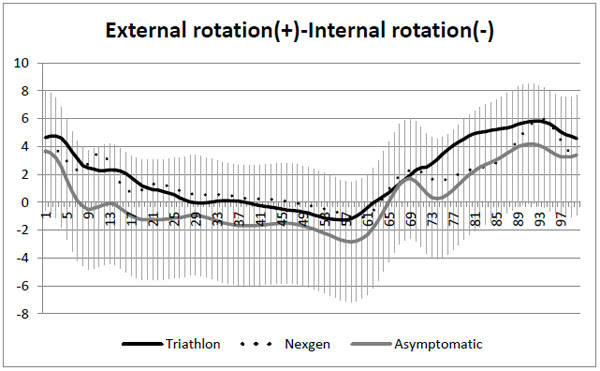
Transverse plane kinematics. SD on asymptomatic knees curve.
4. DISCUSSION
A better understanding of the anatomy and natural knee kinematics have led to the development of implants with mechanical properties that aims at reproducing healthy knee kinematics in order to optimize the results in terms of pain relief, function and patient’s satisfaction. In front of these technological changes, it appears important to validate the benefit associated with their introduction. The first objective of the study was to assess if sagittal, frontal and transverse knee kinematic data post TKA are comparable with those of asymptomatic knees. Then compare kynematic data between two knees of the same patient with two different TKA implant designs. And last, to verify if difference in clinical and subjective scores can be observed between the two knees with different TKA implants. Comparison between TKAs and asymptomatic knees revealed that asymptomatic knees had significantly less knee flexion at initial contact (p < 0.04) and more flexion for most of the swing phase (p between 0.004 and 0.04). Asymptomatic knees also had less varus at loading response, during stance phase and during most of swing phase (p between 0.001 - 0.05) . Transverse plane analysis showed a tendency for asymptomatic knees to be more in internal rotation during stance phase (p 0.02 - 0.04). Comparing both TKA designs, NexgenTMimplant had significantly more flexion at the end of swing phase (p = 0.04) compared to knees with the TriathlonTMimplant. In frontal plane, from initial contact to maximum mid stance angle and between the mean mid stance angle and initial contact NexgenTM TKA had significantly more adduction (varus, p = 0.02 - 0.03). Clinical scores of both TKAs did not have significant difference.
KOOS.
| Sub total | TriathlonTM | NexgenTM | p |
|---|---|---|---|
| Symptoms and stiffness | 80.0 (32.1, 96.4, 18.2) |
74.5 (28.6, 92.9, 18.9) |
0.21 |
| Pain | 79.8 (27.8, 100, 21.8) |
79.8 (52.8, 97.2, 16) |
1.0 |
| Function, daily living | 79.7 (47.1, 100, 22) |
80.4 (60.3, 100, 20.1) |
0.86 |
| Function, sports and recreational activities | 29.3 (0, 90, 28.4) |
22.3 (0, 60, 20.3) |
0.28 |
| Quality of life | 67.1 (18.8, 100, 24.6) |
69.6 (50, 100, 19.6) |
0.64 |
| Total | 72.7 (32.7, 97, 19.7) |
72.0 (51.2, 92.3, 15.8) |
0.86 |
Joint perception.
| Joint perception | TriathlonTM | NexgenTM |
|---|---|---|
| Native or natural joint | 2 (13.3 %) | 1 (6.7 %) |
| Artificial joint with no restriction | 4 (26.7 %) | 3 (20 %) |
| Artificial joint with minimal restriction | 7 (46.7 %) | 9 (60 %) |
| Artificial joint with major restriction | 2 (13.3 %) | 2 (13.3 %) |
| Non functional joint | 0 (0%) | 0 (%) |
Our study has some limitations. First, a post hoc power analysis showed that the study was underpowered with a total number of 13 patients with bilateral TKAs (26 TKAs). For example, with the total ROM in transverse plane (12.7o TriathlonTM, 10.9o NexgenTM), we obtained a study power of 27 %. To obtain a power of 80 % with the same ROM during gait cycle, we would have needed a total of 49 patients. However, patients with two different TKA designs in their knees are quite rare and it was impossible to recruit more patients, as this cohort of staged bilateral TKAs was the result of a change of practice at the hospital in terms of the implant brand used. Also, the fact that the patient could be its own control reinforces the conclusions that can be drawn from this study. Another limitation is the differences in the demographic data between the bilateral TKA group and the asymptomatic group. The asymptomatic subjects were younger and had a lower BMI. It was shown that age causes minor changes in knee kinematics in the sagittal plane [40, 41]. To our knowledge, no literature reported the effect of aging on the frontal and transverse plane kinematics. The age difference might have influenced the results in those two planes, but we cannot quantify this influence if there was one. The asymptomatic group also had a mean lower BMI. This difference between groups might have influenced the kinematics results. Recent studies comparing gait kinematics of TKA and asymptomatic subjects also reported higher BMI in the TKA group [13, 15]. A third limitation is that all patients in the TKA group had the NexgenTM TKA done before the TriathlonTM TKA. Follow-up time was therefore longer for NexgenTM TKA. The minimum follow-up time to be included in the study was 12 months. Despite the fact that this period appears sufficient to recover physically and psychologically from the surgery, it may have an influence on the kinematic parameters and provide a bias on the subjective results of the two implants. It is also possible that having a different TKA implant in the contralateral knee may have influenced the kinematic results of the studied TKA. Finally, patients were asked to fill twice the same subjective questionnaire as one questionnaire was applied for each TKA on the same patient. To our knowledge, the SF-12, KOOS and WOMAC are not validated for this use and it should be taken into account when interpreting the results.
Kinematic analysis during gait of knees with a TriathlonTM and a NexgenTM TKA implants on the same patient showed similar patterns in sagittal, frontal and transverse planes. However some significant differences were found. In sagittal plane, knees with NexgenTM implant had more flexion at the end of swing phase between 83 % and 89 % of gait cycle. These differences have however little impact clinically. Frontal plane analysis showed a tendency for NexgenTM to be more in adduction (varus) during stance without reaching a significant level (p = 0.18 to 0.59). ROM in frontal plan from initial contact to maximum mid stance angle was statistically higher for NexgenTM (1.6ovs 0.4o, p = 0.03) representing a greater varus thrust for NexgenTM from early to mid stance. The difference between the mean frontal plane angle during mid stance and the initial contact was also different between the 2 operated knees. This kinematic parameter can represent a loading characteristic during gait. NexgenTM knees showed an average of 0.8o increase in varus while TriathlonTM knee showed 0.4o towards valgus (p = 0.02). Long-term consequence of this varus thrust could lead to a premature wear of the medial part of this tibial polyethylene component [38]. A potential factor that could help explain this varus thrust in NexgenTM knees is a tendency toward a slightly higher varus mechanical axis post-op compared to TriathlonTM knees (2ovs 1.2o, p = 0.24). However, it is probably not the only factor, because the Pearson correlation coefficient between the mechanical tibiofemoral angle and the peak stance angle in the frontal plane were weak (TriathlonTM: 0.286, NexgenTM: 0.324). Longer follow-up for NexgenTM could also contribute to this result as Orishimo et al. [21] described increased maximum stance adduction at a 12 months follow-up compared to 6 months follow-up. Others factors such as differences in implant design and ligament balancing could also explain this finding. Transverse plane analysis revealed a tendency for TriathlonTM TKA to have higher ROM, but the differences were not significant. It is possible that this finding is attributable to implant design difference where TriathlonTM is designed to allow a degree of freedom in that plane. A study with a higher number of patients would be need to verify this hypothesis.
When comparing TKAs to asymptomatic knees, TKAs had higher knee flexion at initial contact between 1 % and 3 % of gait cycle (p = 0.03). The literature is divergent as for the difference of angulation at initial contact between TKAs and asymptomatic knees. Levinger et al. [13] described more flexion at initial contact for TKAs whereas McClelland et al. [15] reported the opposite. Other studies [17, 39] did not find difference between the groups. The same divergence is found in the arthritic knee gait kinematics literature. Boivin [1] have demonstrated that this variability could be related to the degree of severity of osteoarthritis of the analyzed subjects. It is possible that the pursuit of these variable patterns postoperatively may contribute to this difference in the TKA population. As described widely in the literature [12-17], TKAs had less ROM in sagittal plan (Triathlon: 47.1o, Nexgen: 48.2o, Asymptomatic: 55.4o, p = 0.001) and lower peak knee flexion (Triathlon: 50.4o, Nexgen: 52.8o, Asymptomatic: 57.6o, p = 0.003). In frontal plane, TKA knees showed higher peak varus angle during stance (Triathlon: 4.9o, Nexgen: 6.6o, Asymptomatic: 3.4o, p = 0.05) and swing (Triathlon: 9.0o, Nexgen: 9.2o, Asymptomatic: 3.6o, p = 0.001) and were significantly more in varus during terminal stance (between 26 % to 48 % of gait cycle) (p = 0.04) and during swing phase (59 % to 97 % of gait cycle (p between 0.001 and 0.05). Saari et al. [20] reported significantly higher maximum adduction (varus) for one TKA design out of four studied compared to control group (7ovs 3o, p = 0.009). Milner et al. [39] found a maximum stance adduction of 2.4o for control and 1.8o for TKAs at a mean follow-up of 28 months while McClelland et al.[15]reported a mean stance maximum adduction of 4.6o for control group and 4.5o for 40 TKAs. Hypothesis to explain the differences in frontal plane between TKAs and asymptomatic subject are a mechanical axis in varus for TKAs, sub optimal ligament balancing and the pursuit of preoperative gait patterns. Transverse plane analysis did not reveal significant difference in ROM between the groups. Asymptomatic knees had a tendency to be more in internal rotation during stance with significant differences between 9 % and 13 % of gait cycle (p between 0.02 and 0.04). Asymptomatic knees also had a tendency toward higher peak stance internal rotation (Triathlon: 2.9o, Nexgen: 1.9o, Asymptomatic: 4.5o, p = 0.1). McClelland et al. [15] also reported a higher peak stance internal rotation for control group in comparison with the TKAs (12.6ovs 7.2o, p < 0.001). This tendency toward external rotation for TKA may result from a mild implant malrotation at the moment of surgery compared to natural knee anatomy.
Evaluated implant designs did not influence the clinical scores. The few kinematic differences between the prosthesis were not reflected in the KOOS, WOWAC and SF-12. Joint perception questionnaire showed that the majority of patients perceived both their knee as an artificial joint with no or minimal restriction. A natural joint perception was obtained only for 3 TKAs (10%). It is likely that the kinematic differences exposed in all three planes between TKAs and asymptomatic knees explain why very few patients perceived their reconstructed knee as a natural joint.
The kinematics differences found between our asymptomatic knee group and TKAs suggest that in spite of the development of new implant design, we still are not able to reproduce natural knee kinematics during gait and may explain why few patients perceived their TKA as a natural joint. Moreover, despite different implant designs, few kinematic differences emerged comparing TriathlonTM and NexgenTM TKA design on the same patient. Furthermore, implant design did not seem to influence the clinical scores.
LIST OF ABBREVIATIONS
CONFLICT OF INTEREST
AF is an employee and shareholder of Emovi inc. Other authors declare that they have no competing interest.
ACKNOWLEDGEMENTS
AR was support by a training award for M.D.-M.Sc. students from the Fonds de recherche en santé du Québec (FRSQ).