All published articles of this journal are available on ScienceDirect.

The Relationship Between Neck Pain and Physical Activity
Abstract
Neck pain is a significant societal burden due to its high prevalence and healthcare costs. While physical activity can help to manage other forms of chronic musculoskeletal pain, little data exists on the relationship between physical activity and neck pain. The purpose of this study was to compare physical activity levels between individuals with neck pain and healthy controls, and then to relate disability, fear of movement, and pain sensitivity measures to physical activity levels in each of the two participant groups. 21 participants were recruited for each of the two participant groups (n = 42). Data collection included the use of the Neck Disability Index, the Tampa Scale for Kinesiophobia, electrocutaneous (Neurometer® CPT) and pressure stimulation (JTech algometer) for quantitative sensory testing, and 5 days of subjective (Rapid Assessment of Physical Activity) and objective (BioTrainer II) measurements of physical activity. Analysis of Variance and Pearson’s Correlation were used to determine if differences and relationships exist between dependent variables both within and between groups. The results show that individuals with mild neck pain and healthy controls do not differ in subjectively and objectively measured physical activity. While participants with neck pain reported higher neck disability and fear of movement, these factors did not significantly relate to physical activity levels. Perceived activity level was related to pain threshold and tolerance at local neck muscles sites (C2 paraspinal muscle and upper trapezius muscle), whereas measured activity was related to generalized pain sensitivity, as measured at the tibialis anterior muscle site.
INTRODUCTION
Neck pain is one of the most common musculoskeletal complaints, with 30-50% of the population affected every year and two out of every three individuals experiencing neck pain in their lifetime [1-3]. Furthermore, 50-85% of those affected do not experience complete recovery [4]. Neck pain also accounts for considerable healthcare costs and productivity loss [5, 6]. Individuals suffering from neck and back pain spent approximately 73% more on healthcare than those without spine problems, with expenditures increasing by 65% from 1997 to 2005 [5]. Neck pain is particularly prevalent in office workers due to the increasing use of computers [7, 8]. More than 50% of workers reported a relationship between their occupation and neck pain, while 14% experienced activity limitations due to neck pain each year [9, 10]. As a result of the significant societal and health burden associated with neck pain, there is increasing focus on treatments to alleviate neck pain.
Physical activity is a common management strategy for chronic musculoskeletal pain [11-14]. Strengthening and fitness exercises have shown to be effective at preventing neck pain and reducing its severity [15-18]. Workers participating in general exercise and sport activities were more likely to experience relief in their neck pain [10, 15]. Conversely, inactive individuals are more likely to develop chronic musculoskeletal pain and other related disorders [19, 20]. Despite evidence for the benefits of physical activity in musculoskeletal pain treatment, reduced levels and altered patterns of physical activity, which are believed to contribute to decreased muscle functionality, are reported in individuals affected with chronic low back pain [21-23]. Currently, little data is available concerning physical activity levels in neck pain populations.
Various sensory deficits have been reported in neck pain populations. Decreased pain threshold and sensory hypoaesthesia are common features in people with whiplash-associated disorders, which represent altered pain processing mechanisms in the central nervous system [24-26]. Peripheral nerve deficits and widespread hypersensitivity were also noted in female office workers with mild and moderate neck pain [27]. Abnormalities in pain perception are commonly studied using quantitative sensory testing (QST), which measures perception thresholds using a variety of controlled stimuli [25, 28, 29]. QST has been validated as a means of characterizing the somatosensory profiles of patients [30]. Altered pain sensitivity may affect physical activity levels in individuals suffering from chronic neck pain, although this relationship has not been examined.
Fear-avoidance is a proposed psychosocial factor that may affect both physical activity levels and the development of chronic pain in individuals experiencing neck pain [31-34]. The fear-avoidance model suggests that when acute pain is exaggerated and misinterpreted as threatening, individuals may develop pain-related fear and exhibit safety-seeking behavior, such as fear of movement (kinesiophobia) or avoidance of activities that are anticipated to cause (re)injury or pain [31]. These coping behaviors can be maladaptive and result in disability and disuse, leading to chronic pain [31]. Individuals with chronic musculoskeletal disorders and high kinesiophobia reported greater activity-associated pain and low levels of physical activity [35, 36]. In neck pain populations, measures of kinesiophobia are predictive of chronic disability and work capacity [32, 33, 37-39]. Fear-avoidance has also been shown to affect pain sensitivity [39-44]. Together, these findings suggest that a combination of psychological and neurological factors may affect physical activity levels in neck pain populations.
Few studies have examined the effects of neurological and psychological factors on physical activity levels in neck pain populations. The aim of this study was to compare physical activity levels between individuals with neck pain and healthy controls, with individuals with neck pain expected to be less physically active. Secondly, we examined whether fear, disability and pain sensitivity relate to physical activity levels. It was expected that each of these variables would be negatively correlated with physical activity levels.
MATERIALS AND METHODOLOGY
Participants
Participants between the ages of 18 and 75 years were recruited via convenience sampling from McMaster University using on-campus posters and university website advertisements. Participant databases developed by the Head and Neck, Shoulder, Arm (HaNSA) and the McMaster Hand, Arm, Neck Disability (MacHAND) research groups were also used to recruit individuals with neck pain. Only those participants who consented to be contacted for future studies were contacted through the database.
Inclusion criteria for the neck pain group included chronic or recurrent neck pain for greater than three months and pain intensity of greater than 2 out of 10 at the time of the first visit (mean neck pain score at first visit = 3.55 (±1.23) out of 10). The control group consisted of healthy adults who reported no current or prior neck pain or injury affecting the neck for at least three months. Individuals were excluded if they had any underlying neurological conditions or intake of analgesic medication within eight hours prior to pain sensitivity assessments to avoid confounding bias. Informed consent was obtained from all participants. A total of 42 participants were recruited from June 2010 to March 2011, with 21 participants in each of the neck pain and healthy control groups. This study was approved by the McMaster University Health Sciences Research Ethics Board.
Instrumentation
Fear of Movement
Fear of movement/ (re)injury can be assessed using theEnglish version of the Tampa Scale for Kinesiophobia (TSK) [45]. The TSK contains 17 statements rated on a 4-point scale according to the participant’s agreement with the statements, with 1 indicating strongly disagree and 4 indicating strongly agree. Total score ranges from 17 to 68, with scores greater than 37 reflecting high fear-avoidance beliefs and fear of movement. The TSK demonstrated moderate agreement (intra-class correlation coefficient = 0.80) between raters, internal consistency (Cronhach’s alpha = 0.89), and concurrent validity with other fear-avoidance measures (r = 0.44 to0.45) in patients with neck pain [46].
Self-Reported Neck Function
The Neck Disability Index (NDI) is the most widely used instrument to measure perceived disability associated with neck pain [47]. The NDI contains ten items, with seven items assessing daily activities, two items assessing pain, and one item related to concentration. Each disability category is rated out of five, with “0” representing no disability and “5” representing complete disability. NDI scores can be used to categorize disability: no disability (0 to 4), mild (5 to 14), moderate (15 to 24), severe (25 to 34), and complete disability (greater than 34) [47, 48]. Several studies have reported high validity and reliability of the NDI [47, 49-51].
Quantitative Sensory Testing
Pain threshold and tolerance were measured using electrocutaneous and pressure stimuli. Pain stimuli were applied by are search assistant at two sites on the cervical spine: the paraspinal muscle lateral to C2, and the upper trapezius muscle midway between C7 and the lateral border of the acromion (Fig. 1). These sites, which are cited as sources of joint and muscle pain in neck pain syndromes, are commonly assessed in somatosensory characterization of neck pain in patients [25, 27, 52]. Pain measures were also assessed in the upper one-third of the muscle belly of the tibialis anterior (Fig. 1). This site is remote to the origin of neck complaints and was chosen to measure general sensitivity, as seen in previous studies related to neck pain [25, 27, 52].
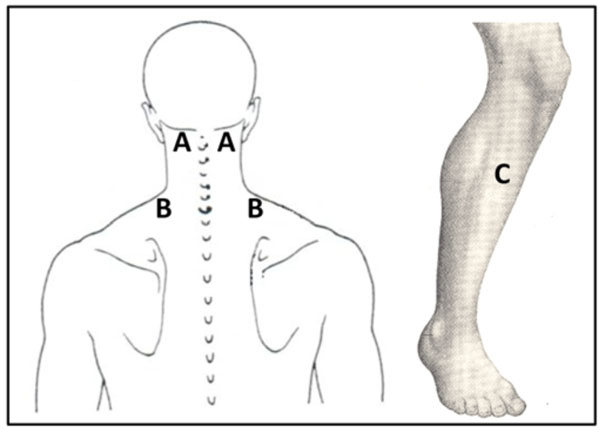
QST Test Sites (A: C2 paraspinal muscle, B: upper trapezius muscle, and C: tibialis anterior muscle).
Current Perception Threshold (CPT) Testing
The Neurometer® CPT (Neurotron, Baltimore, MD, USA) was used to apply electrocutaneous stimulation and measure pain thresholds. The device applies three different sinusoidal frequencies (2000 Hz, 250 Hz, and 5 Hz) at various intensities to selectively stimulate nerve fibre populations. The 2000 Hz frequency stimulates large Aβ fibres; 250 Hz activates Aδ fibres; a stimulus of 5 Hz stimulates small C-polymodal fibres. The Neurometer emits non-invasive electrical current via small gold-plated surface electrodes on test sites. CPT testing has been used to measure sensory deficits in chronic whiplash populations [25, 29].
Participants self-administered the electrical stimuli, which increased in intensity through a series of 25 pre-determined levels. Participants received standardized instructions and were given a practice session prior to start of the test to ensure understanding of the instructions. The test started when participants held down the test button. When the stimulus was first perceived as “uncomfortable” or “painful”, the participant released the test button to stop the test; this intensity was recorded as the electrical pain threshold. Participants were then instructed to start the test again and release the button when the stimulus became “intolerable”; this intensity was recorded as the pain tolerance. Current-evoked pain measures were determined using the 2000 Hz and 5 Hz frequencies.
Pressure Pain Threshold (PPT) Testing
Pressure stimuli were applied and quantified using the JTech algometer (JTech Medical, Salt Lake City, UT, USA). The hand-held device contains a 1 cm2 circular probe. Algometry has been shown to be a valid and reliable measure of PPT [53-55].
A research assistant applied the algometer to the test sites on the participants (Figs. 1, 2). Standardized instructions were given by the research assistant to the participants prior to the start of the test. Participants indicated when the pressure became “uncomfortable” (pain threshold). Pressure was continually applied until participants indicated when the pressure became “intolerable” (pain tolerance), at which point the test stopped. The test was repeated three times, with a 10-second rest period between each test. The average value of the three repetitions was used as the for pain threshold and pain tolerance.
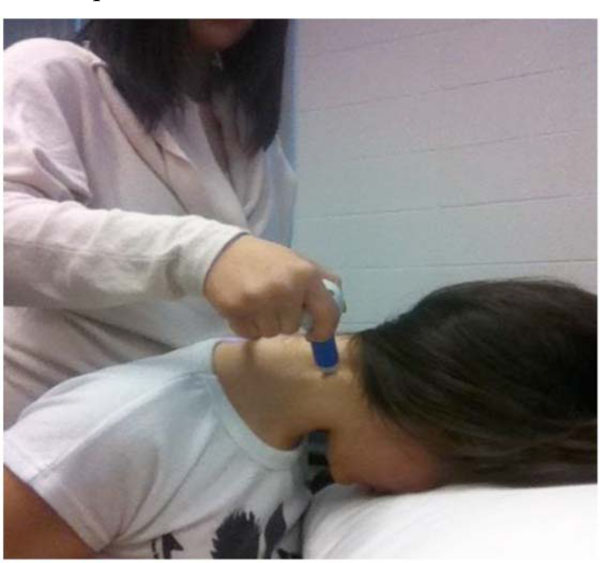
JTech algometer applied to the C2 paraspinal test site.
Self-Reported Physical Activity
The Rapid Assessment of Physical Activity (RAPA) is an easy-to-score tool to measure self-reported physical activity [56]. It contains nine “yes” or “no” statements that assess weekly aerobics activity (7 questions), as well as strength and training (2 questions). Aerobic activities are categorized according to intensity. Light activities slightly increase heat rate and do not affect participants’ capacity to talk and sing. Moderate activities are defined as ones that increase heart rate and affect aerobic capacity to sing, such as fast walking and gentle swimming. Vigorous activities significantly increase heart rate and limit capacity to talk, such as running and racquet sports. The aerobics portion of the RAPA can be used to classify participants as “sedentary”, “underactive”, “underactive regular – light activities”, “underactive regular” or “active” [56]. The “active” status is based on the physical activity guidelines by the Centre of Disease Control and Prevention of 30 minutes or more of moderate activity five days per week, or 20 minutes of vigorous activity three days per week [56]. The questionnaire has been validated against other commonly used physical activity surveys [56]. For this study, the RAPA was modified by changing the items to reflect daily, instead of weekly, physical activity. For analysis purposes, the RAPA score used herein is based on the daily average of the 7-point self-report aerobics scale, where 1 = rarely do any physical activity, and 7 = 20 minutes of vigorous activities 3+ days/week. Thus, the RAPA score used is a subjective measure of daily physical activity intensity.
Accelerometry
Objective activity levels were measured using the BioTrainer II (IM Systems, Baltimore, MD, USA). The device contains a one-dimensional piezoelectric accelerometer positioned at 45o to the vertical and is able to measure bi-directional movements. The BioTrainer II measures and stores daily total activity count, which is expressed in absolute “g” units. Physical activity types are not distinguishable by the BioTrainer II; therefore, the accelerometer served only as a measure of total daily whole body movement (i.e. where the centre of gravity undergoes some displacement such as during walking or stair climbing, rather than during more stationary and extremity-specific activities such as bicycling or weight training). The accelerometer data was used to calculate an objective measure of average physical activity intensity and average daily duration of physical activity, where the physical activity intensity measure is used as a surrogate for an objective measure of the quality of physical activity. Physical activity intensity was calculated by dividing the daily activity count from the BioTrainer II by the duration of accelerometer use, where daily duration of physical activity is the number of hours of accelerometer usage.
The BioTrainerII was worn on the waist, closest to the centre of gravity, to most reliably measure full-body activity levels [57]. The device has not been previously used in accelerometry-based research; however, it contains the same technology as the BioTrainer Pro, which has been validated and found to be comparable to other accelerometers [58-60]. Participants were instructed on the proper use of the accelerometer, which included wearing the accelerometer during all waking hours except when bathing or swimming. An information sheet was also provided to all participants that included usage instructions and researcher contact information.
Procedure
Assessment of disability, kinesiophobia, and pain measures were conducted in the MacHAND laboratory at McMaster University. After being given an explanation of the study and required tasks, participants completed the TSK and NDI questionnaires. Pain threshold and tolerance were then measured in the following order: CPT (C2 paraspinal, upper trapezius, tibialis anterior) and PPT (C2 paraspinal, upper trapezius, tibialis anterior). Participants with neck pain were tested bilaterally at the cervical spine sites, and unilaterally on the dominant side at the tibialis anterior site. Control participants were tested on their dominant side at all test sites. Cervical spine sites were tested with participants in a supine position (Fig. 2), and the tibialis anterior site was assessed with participants in a seated position. Upon completion of the pain assessment, participants were equipped with the BioTrainer II. Data of habitual activity level was then collected over five days during waking hours, which complies with the recommendation of three to five days of monitoring to achieve a reliable estimate of activity levels [57]. During this time, participants recorded the daily duration of accelerometer use and their perceived activity level using the RAPA. Devices and activity logs were collected from participants after one week.
Statistical Analysis
SPSS 18.0 was used for all statistical analyses. Descriptive statistics of participant groups were calculated and expressed as means and standard deviation (SD). Analysis of variance (α = 0.05) was used to determine differences between participant groups for mean activity intensity (objective physical activity measure) and mean RAPA score (subjective physical activity measure). Pearson’s correlations were used to explore the relationship between fear of movement, neck disability, pain threshold and tolerance, and physical activity intensity levels. The practical significance of the effects of these psychophysical factors on measured and self-reported physical activity levels was interpreted according to Cohen’s effect sizes for correlation coefficients: correlations are of insignificant practical importance when r ≤ 0.10, small when 0.10 ≤ r < 0.30, moderate when 0.30 ≤ r < 0.50, and strong importance when r ≥ 0.50 [61]. Data were tested for normal distribution using the Shapiro-Wilk test, and for equal variances between groups using Levene’s test.
RESULTS
Two participants from the neck pain group had missing accelerometry data due to technical problems with the devices. Thus, results are based on 39 participants (19 neck pain and 21 controls). General characteristics of the two groups are displayed in Table 1. Participants with neck pain and controls were similar in age and gender. The neck pain intensity scores indicated greater neck pain for individuals with neck pain than those in the control group, with average scores of 3.55 out of 10 for those with neck pain. The mean score for self-reported disability on the NDI for the neck pain group was 13.6, which indicates mild levels of disability due to neck pain. The neck pain group also had a mean TSK score of 37.6, signifying high fear of movement. As expected, participants with neck pain displayed greater disability (p = 0.00) and fear of movement (p = 0.01) in comparison with controls.
Demographic Data and Descriptive Statistics
| Variable | Neck Pain (n = 19) | Control (n = 21) | P-Value |
|---|---|---|---|
| Gender (% Female) | 76% | 79% | |
| Age (years) | 28.0 ±13.7 | 23.7 ± 6.6 | 0.21 |
| Neck Pain Intensity Score | 3.55 ± 1.23 | 0.05 ± 0.23 | 0.00* |
| Disability (NDI) | 13.6 ± 3.8 | 1.3 ± 1.4 | 0.00* |
| Fear of Movement (TSK) | 37.6 ± 5.8 | 32.3 ± 5.7 | 0.01* |
| RAPA score | 4.0 ± 1.2 | 3.9 ± 1.4 | 0.91 |
| Physical Activity Intensity (g/hour) | 1337.6 ± 604.0 | 1363.8 ± 643.2 | 0.90 |
| Daily Duration of Physical Activity (activity hours/day) | 11.92 ± 2.34 | 12.75±2.02 | 0.24 |
Values are expressed as means ±SD. NDI = Neck Disability Index; TSK = Tampa Scale of Kinesiophobia; RAPA = Rapid Assessment of Physical Activity. * indicates p < 0.05.
Physical Activity Between Participants with Neck Pain and Controls
Table 1 presents subjectively and objectively measured physical activity levels of the neck pain and control groups. There were no significant differences between groups on self-reported (p = 0.91) or measured physical activity, as indicated by both physical activity intensity (p = 0.90) and daily duration (p = 0.24). Based on the RAPA scores, both groups scored within the “underactive regular” category; participants engaged in moderate physical activities less than 30 minutes a day or less than 5 days a week, or participated in vigorous activities less than 20 minutes a day or less than 3 days a week.
There was no statistically significant correlation between the average subjective and objective physical activity intensity measures (r = 0.08, p = 0.63). There were moderate concordance between RAPA and physical activity intensityon Day 1 (r = 0.38, p = 0.02) and Day 2 (r = 0.48, p < 0.01). However, statistically significant correlations were not present on Days 3 to 5 (p > 0.05) (Table 2).
Means (and Standard Deviations) of Daily Rapa Scores and Physical Activity Intensity, and the Correlation Between these Two Variables
| Statistic | Day 1 | Day 2 | Day 3 | Day 4 | Day 5 |
|---|---|---|---|---|---|
| Average RAPA score | 3.70 (1.78) | 4.25 (1.86) | 4.23 (1.98) | 3.92 (1.93) | 4.14 (1.73) |
| Average Physical Activity Intensity (g/hour) | 1439.98 (797.20) | 1458.00 (927.92) | 1250.10 (814.08) | 1320.15 (889.13) | 1379.13 (839.64) |
| Pearsons correlation | 0.38* | 0.48* | 0.24 | 0.16 | -0.08 |
| p-value | 0.02** | 0.00** | 0.13 | 0.33 | 0.66 |
* Indicates moderate or strong correlation (r ≥ 3), **indicates p < 0.05.
Physical Activity, Fear and Disability
Both patient and control groups had a moderate, yet statistically insignificant, correlation between fear of movement and whole body activity, as measured by accelerometry (neck pain group: r = 0.38, p = 0.11; control group: r = -0.40, p = 0.07). These relationships indicate that as fear of movement scores increased, there was a trend towards decreased activity in the control group, but increased activity in the individuals with neck pain.
Physical Activity and CurrentPain Threshold (CPT)
Self-reported physical activity level (RAPA score) was related to current pain thresholds in participants with neck pain (Table 3). Physical activity was most correlated to pain threshold at 2000 Hz at the affected C2 paraspinal muscle (r = 0.65, p = 0.01) and moderately correlated, yet statistically insignificant, at the affected upper trapezius site (r = 0.35, p = 0.19). There was no significant relationship between the RAPA and the tibialis anterior pain threshold, at 2000 Hz (r = 0.05, p = 0.75) or 5 Hz (r = -0.05, p = 0.79).
Correlations Between Both Subjective (Average RAPA Score) and Objective (Physical Activity Intensity (g/hr)) Physical Activity and the Multi-Location CPT Recordings
| Current Perception Threshold (CPT) | ||||||||||||
|---|---|---|---|---|---|---|---|---|---|---|---|---|
| Affected Side | Unaffected Side | Dominant Side | ||||||||||
| Pain Test Level |
Physical Activity Measure |
Statistic | Paraspinal (C2) |
Upper Trapezius (C7) |
Paraspinal (C2) |
Upper Trapezius (C7) | Tibialis Anterior |
|||||
| 5 Hz | 2000 Hz | 5 Hz | 2000 Hz | 5 Hz | 2000 Hz | 5 Hz | 2000 Hz | 5 Hz | 2000 Hz | |||
| Pain Threshold |
Accelerometer (g/hr) | Pearson's Correlation |
-0.09 | -0.04 | -0.37* | -0.10 | -0.15 | -0.41* | -0.24 | -0.17 | 0.10 | -0.01 |
| p-value | 0.76 | 0.87 | 0.15 | 0.70 | 0.50 | 0.04** | 0.26 | 0.42 | 0.53 | 0.95 | ||
| Mean daily RAPA | Pearson's Correlation |
0.15 | 0.65* | 0.20 | 0.35* | -0.04 | 0.03 | 0.13 | 0.20 | -0.05 | 0.05 | |
| p-value | 0.59 | 0.01** | 0.46 | 0.19 | 0.84 | 0.88 | 0.54 | 0.36 | 0.79 | 0.75 | ||
| Pain Tolerance |
Accelerometer (g/hr) | Pearson's Correlation |
-0.14 | 0.42* | -0.22 | 0.16 | 0.08 | -0.07 | -0.24 | -0.01 | 0.05 | 0.16 |
| p-value | 0.62 | 0.10 | 0.41 | 0.55 | 0.72 | 0.75 | 0.25 | 0.95 | 0.77 | 0.34 | ||
| Mean daily RAPA | Pearson's Correlation |
0.40* | 0.55* | 0.27 | 0.19 | 0.02 | 0.06 | 0.19 | 0.07 | 0.03 | 0.03 | |
| p-value | 0.13 | 0.03** | 0.32 | 0.48 | 0.92 | 0.77 | 0.37 | 0.76 | 0.87 | 0.86 | ||
* Indicates moderate or strong correlation (r ≥ 3), **indicates p < 0.05.
There was a statistically significant negative correlation of moderate strength between accelerometer data and the 2000 Hz-stimulated pain thresholds at non-affected C2 paraspinal muscle sites (r = -0.41, p = 0.04), which shows that as the pain threshold at these sites increased, there was lower objectively measured physical activity. A negative moderate correlation was also found at affected upper trapezius sites, but the relationship did not meet statistical significance (r = -0.37, p = 0.15). At the tibialis anterior, objectively measured physical activity was not correlated with pain threshold at 2000 Hz (r = -0.01, p = 0.95) or at 5Hz (r = 0.10, p = 0.53).
Physical Activity and Current Pain Tolerance
Self-reported activity status was strongly correlated with 2000 Hz-stimulated pain tolerance at the affected C2 paraspinal muscle (r = 0.55, p = 0.03). There was also a moderate correlation approaching statistical significance between the RAPA and 5 Hz-stimulated pain tolerance at the affected C2 site (r = 0.40, p = 0.13).
Accelerometer data was moderately related to pain tolerance at affected C2 site at 2000 Hz (r = 0.42, p = 0.10). Both self-reported and measured physical activity levels were not correlated to pain tolerance at the tibialis anterior (r < 0.3, p > 0.05).
Physical Activity and Pressure Pain Threshold
Self-reported physical activity was significantly related to pressure pain threshold (r = 0.50, p = 0.03) at the affected upper trapezius muscle (Table 4). Although the correlations did not reach statistical significance, higher self-reported activity level was moderately related to higher pain threshold at the affected (r = 0.32, p = 0.23)and non-affected C2 paraspinal muscles (r = -0.31, p = 0.14). The RAPA did not significantly correlate with the tibialis anterior pain threshold (r = 0.01, p = 0.94).
Correlations Between Both Subjective (Average RAPA Score) and Objective (Physical Activity Intensity (g/hr)) Physical Activity and the Multi-Location PPT Recordings
| Current Pressure Pain Threshold (PPT) | |||||||
|---|---|---|---|---|---|---|---|
| Affected Side | Unaffected Side | Dominant Side | |||||
| Pain Test Level | Physical Activity Measure |
Statistic | Paraspinal (C2) |
Upper Trapezius (C7) |
Paraspinal (C2) |
Upper Trapezius (C7) |
Tibialis Anterior |
| Pain Threshold | Accelerometer (g/hr) |
Pearson's Correlation | 0.42* | 0.36* | 0.14 | 0.12 | 0.32* |
| p-value | 0.11 | 0.17 | 0.51 | 0.56 | 0.05** | ||
| Mean daily RAPA | Pearson's Correlation | 0.32* | 0.50* | -0.31* | -0.20 | 0.01 | |
| p-value | 0.23 | 0.03** | 0.14 | 0.36 | 0.94 | ||
| Pain Tolerance | Accelerometer (g/hr) |
Pearson's Correlation | 0.50* | 0.37* | 0.13 | 0.11 | 0.36* |
| p-value | 0.05 | 0.12 | 0.54 | 0.62 | 0.02** | ||
| Mean daily RAPA | Pearson's Correlation | 0.31* | 0.52* | -0.40* | -0.09 | 0.08 | |
| p-value | 0.24 | 0.02** | 0.05 | 0.69 | 0.64 | ||
* Indicates moderate or strong correlation (r ≥ 3), **indicates p < 0.05.
Accelerometer measurements were significantly correlated to tibialis anterior pain threshold (r = 0.32, p = 0.045). There were moderate, but statistically insignificant, correlations between objectively measured activity levels and pain threshold at affected C2 paraspinal (r = 0.42, p = 0.11) and upper trapezius muscle sites (r = 0.36, p = 0.17).
Physical Activity and Pressure Pain Tolerance
The RAPA was strongly correlated to pressure pain tolerance at the affected upper trapezius muscle site (r = 0.52, p = 0.02). There was also a moderate, but statistically insignificant, correlation between self-reported activity level and pain tolerance at the affected C2 paraspinal muscle site (r = 0.31, p = 0.24). At the non-affected C2 paraspinal muscle site, a RAPA level was negatively correlated with pain tolerance(r = -0.40, p = 0.05). The RAPA did not significantly correlate with pain tolerance (r = 0.08, p = 0.64) at the tibialis anterior muscle site.
Objectively measured activity was significantly correlated topain tolerance at the tibialis anterior (r = 0.36, p = 0.02) and affected C2 paraspinal muscle (r = 0.50, p = 0.05). A moderate, but statistically insignificant, correlation was also present between accelerometer data and pressure pain tolerance at the affected upper trapezius (r = 0.37, p = 0.12).
DISCUSSION
This study determined that physical activity levels, both self-reported (i.e., RAPA score) and objectively measured (i.e., accelerometry data), were comparable in people with neck pain and healthy individuals. Self-reported and measured physical activity levels were moderately correlated, which may indicate that either accelerometers or participants did not accurately reflect actual activity, or that errors of measurement on both approaches lower the observed correlation estimators of their activity levels.
Pain-free individuals with higher fear of movement had lower measured activity intensity, which suggests that fear-avoidance beliefs may modulate physical activity even without neck pain being present. Although participants with neck pain reported greater neck disability and fear of movement, these factors did not significantly relate to either perceived or measured activity intensity levels. It is important to note that the current findings were based on participants with mild disability due to neck pain; more severe disability due to neck pain may have a more profound effect on physical activity levels. It may also be that individuals with neck pain are not consciously aware of their pain-related fears or have alternative cognitive processes to manage their fear-avoidance beliefs. A study by Nederhand and colleagues (2006) demonstrated that fear of movement in individuals with post-traumatic neck pain was associated with decreased neck muscle activation, which may affect isolated neck motions and perception of physical activity [62]. Altered activation of neck muscles may affect full-body movements measured by the accelerometer to a lesser degree. The lack of association between fear of movement and activity levels in neck patient participants suggests that cognitive-based interventions aimed at reducing fear-avoidance beliefs may not be a primary target for increasing physical activity in this patient population.
The current study also found that increased self-reported physical activity levels correlated with higher pain threshold and tolerance at affected neck sites. Increased muscle pain after exercise is a common phenomenon and pain may be used as an indicator of intensity of muscle usage [35]. High pain threshold and tolerance indicate a low sensitivity to pain, which may lead individuals with neck pain to inaccurately estimate their activity level. Pain sensitivity at the neck may also alter neck movements that are perceived and reported with the RAPA, rather than full-body movements that are measured with the accelerometers. Measured physical activity was significantly related to pressure pain sensitivity at the tibialis anterior. General mobility and activity, as measured by the accelerometers, reflect lower extremity motion, which may be affected by general pain sensitivity.
There were several limitations to this study. First, the BioTrainer II was unable to accurately measure cervical and upper extremity motion, which is more limited than lower body motions in individuals with neck pain [63]. This limitation is relevant to the current study given the benefit that neck-specific exercises have on individuals with neck pain [64]. However, the focus of this study is not on specific upper extremity exercises but rather on general physical activity in both neck pain and pain-free individuals, which renders both the RAPA score and Bio Trainer II appropriate measurement tools for this study.
The validity of the accelerometry measurement may also vary across isolated lower extremity activities. For example, we found that accelerometers placed at the hip were not able to accurately measure energy expenditure while biking. Failure to capture information of upper and lower limb usage may result in inaccurate activity profiles, and may therefore explain the poor correlation between self-reported and measured activity. Participant adherence to accelerometer use was also a potential source of error. The accelerometer was to be worn during waking hours in order to fully capture information about daily activity. Most participants did not report discomfort while wearing the device. However, some noted that the BioTrainer II interfered with vigorous activities. To minimize this potential BioTrainer II adherence error, clear usage instructions were given and participants were required to complete an activity monitoring log [57]. Finally, although the group repeatability of pressure algometry is acceptable, there is high individual variability in pain threshold and tolerance levels [53]. Inattention and/or deception intentions on the part of participants when performing the PPT protocol could also alter variability of responses [28]. To minimize PPT variability, a standardized testing environment and instructions were used.
CONCLUSIONS
In summary, the results of this study show that participants with neck pain, whom reported mild levels of disability, and pain-free controls, whom reported no current or prior neck pain or injury affecting the neck for at least three months, did not differ in the amount of subjective and objectively measured whole body physical activity, as determined using RAPA scores and accelerometry data, respectively. Participants with neck pain reported higher neck disability and fear of movement, although these factors did not significantly relate to physical activity levels. The results of this study also show trends demonstrating that perceived activity level may be related to pain threshold and tolerance at local neck muscles sites, whereas measured activity may be related to pain measures at the tibialis anterior, which reflects generalized pain sensitivity. However, the lack of consistent statistically significant findings with respect to the relationship between physical activity measures and both CPT and PPT measures suggests a need for more research related to these measures.
The findings of this study also highlight the need for more reliable methods of objectively measuring upper limb movements, especially for use in research on neck pain and upper extremity disorders. There is also a need for the development of more affordable and reliable accelerometry devices [57]. Further qualitative research investigating the impact of neck pain on activity is warranted. It was found that neck disability and fear did not affect activity levels in participants with neck pain; however, the findings of the current study were based on participants with mild disability due to neck pain. Future studies need to examine the effects of fear of movement and pain sensitivity on physical activity levels in participants with more severe disability due to neck pain. Furthermore, the process by which these individuals overcome their fear-avoidance beliefs and how pain affects decisions to engage in physical activity are not well-known. Cognitive and neurological factors play significant roles in affecting perception of pain and the interaction between these factors can be further explored with qualitative studies. Exercise is commonly prescribed as a treatment for individuals with neck pain; however, its benefits remain controversial and patient adherence to exercise programs is often low [65]. Better understanding of the relationship between neck pain and physical activity can aid in the development of more effective treatment programs and strategies to improve adherence.
CONFLICT OF INTEREST
The authors confirm that this article content has no conflict of interest.
ACKNOWLEDGEMENTS
The authors would like to thank the Canadian Institutes of Health Research (CIHR) for their funding support, and Margaret Lomotan for her assistance with the revision process.
This work was supported by Canadian Institutes of Health Research (CIHR).