All published articles of this journal are available on ScienceDirect.

Bone Mineral Density in Healthy Female Adolescents According to Age, Bone Age and Pubertal Breast Stage
Authors Info & Affiliations
Abstract
Objectives:
This study was designed to evaluate bone mineral density (BMD) in healthy female Brazilian adolescents in five groups looking at chronological age, bone age, and pubertal breast stage, and determining BMD behavior for each classification.
Methods:
Seventy-two healthy female adolescents aged between 10 to 20 incomplete years were divided into five groups and evaluated for calcium intake, weight, height, body mass index (BMI), pubertal breast stage, bone age, and BMD. Bone mass was measured by bone densitometry (DXA) in lumbar spine and proximal femur regions, and the total body. BMI was estimated by Quetelet index. Breast development was assessed by Tanner’s criteria and skeletal maturity by bone age. BMD comparison according to chronologic and bone age, and breast development were analyzed by Anova, with Scheffe’s test used to find significant differences between groups at P≤0.05.
Results:
BMD (g·cm-2) increased in all studied regions as age advanced, indicating differences from the ages of 13 to 14 years. This group differed to the 10 and 11 to 12 years old groups for lumbar spine BMD (0.865±0.127 vs 0.672±0.082 and 0.689±0.083, respectively) and in girls at pubertal development stage B3, lumbar spine BMD differed from B5 (0.709±0.073 vs 0.936±0.130) and whole body BMD differed from B4 and B5 (0.867±0.056 vs 0.977±0.086 and 1.040±0.080, respectively).
Conclusion:
Bone mineralization increased in the B3 breast maturity group, and the critical years for bone mass acquisition were between 13 and 14 years of age for all sites evaluated by densitometry.
INTRODUCTION
Osteoporosis is considered to be one of the most serious public health diseases. Studies have shown it to be a pediatric disease that manifests during senility, affecting 30% of all post-menopausal Caucasian women and 70% of those aged 80 years, and can result in some type of fracture or disability. In addition, the incidence of osteoporosis in Asia and Latin America will tend to increase five-fold in the next 40 to 50 years due to improving life expectancy. Other aspects that have been considered are the demands resulting from osteopenia and osteoporosis such as: pain and suffering, long-term hospitalization, temporary and permanent disability, and the allocation of substantial resources towards the recuperation of these patients [1-3].
Infancy and adolescence are periods where substantial physical growth and major changes in body composition are seen accompanied by high bone mineralization rates [4-6], 25% of bone mass is incorporated in the two years around peak height velocity (PHV) [5]. Ninety percent or more of adult bone mass is obtained during childhood and puberty. The impacts and benefits obtained in bone health which will be seen throughout life seem to be strongly related to bone mass gain during the first 20 years of life [7, 8]. Some studies have stated that low bone mass gain during puberty could permanently influence bone mineral density and content in adulthood [9, 10]. However other recent studies have raised doubts as to whether bone mass acquired in this stage of life can serve as a “reserve” for future years [11]. Perhaps bone mass increase only has a temporary role, demanding constant maintenance to remain complete in later life, demonstrating sensitivity in all phases of life to genetic factors and adopted lifestyle. Studies have been performed supplementing children and adolescents with calcium, demonstrating sequential increase in bone mass, however the effect on bone mineralization was lost some years after supplement suppression. Responses to these studies are still open in literature [11] with longitudinal studies needed to provide patient follow-up for decades so that the cause – effect relationship can be confirmed or refuted, and so that all the interest surrounding accurate dynamic evaluation of bone tissue during puberty is not just based on this phase being critical for increasing bone reserves and minimizing losses in later life [5]. It is important to know bone mass in adolescents to determine those who present low bone mass in virtue of the consequent disorders and chronic diseases which may affect them, those with poor accrual, and to have a better understanding of bone metabolism [12].
The World Health Organization and the International Society of Clinical Densitometry (ISCD) recommend that in children and adolescents, interpretation of BMD is performed comparing data to Z-score for age and gender, and that without definitive agreement, other variables are included in studies, such as skeletal maturity obtained by measuring bone age (BA) and evaluating puberty stages and body composition, which contribute to the understanding of bone mineralization [12]. Through such recommendations, it can be suggested that to only evaluate bone mass based on gender and age, when interested in adolescents, may be insufficient as chronological age includes individuals at different development stages of biological maturity.
Bone mass decline which begins in a person’s 30’s, decreases by 1% to 2% each year in women and by 0.3% to 1% in men; this demonstrates that osteoporosis has a high prevalence in both sexes [13]. In light of these statements, participants at the 2001 Consensus on Osteoporosis: Prevention, Diagnosis, and Treatment, who had previously judged it as a natural event linked to aging in women, agreed to no longer consider it gender and age related, but consider it as a preventable disease [14].
The best way to diagnose osteoporosis in clinical practice is by dual-energy X-ray absorptiometry (DXA). DXA is a quantitative method for bone mass proposed by the WHO which allows accurate estimation of bone mineral mass density and content according to age, gender, and race. This can help quantify the rate of bone loss and estimate the risk of fractures. These characteristics highlight the important role of DXA in bone disease diagnosis [15].
Faced with many factors involved in interpreting results from bone metabolism evaluation during puberty and their probable implications on adult bone health, there is a need to increase knowledge and widen application of DXA in clinical practice and observation, using it as a tool to help understand bone metabolism during puberty in female adolescents. Based on these concepts, the objective of this study was to evaluate BMD at different ages in healthy female Brazilian adolescents and to determine BMD behavior in these adolescents in function of chronological age, skeletal maturity, and pubertal breast stage.
MATERIALS AND METHODOLOGY
Healthy female white adolescent volunteers, aged between 10 and 20 incomplete years, were invited to participate in this study. The volunteers were students at La Salle College, Botucatu, São Paulo State (part of the Associação Brasileira de Educadores Lassalistas), and Santa Marcelina College, a network of private schools in Brazil. Of the 497 students in both schools, 72 adolescents were included who met all inclusion criteria and participated in all evaluations. As all participants were selected from two high fee private schools, they were considered as belonging to top socioeconomic level.
The study was conducted according to guidelines laid down in the declaration of Helsinki and procedures involving humans and were approved by Botucatu School of Medicine Ethics Committee – UNESP, protocol No 07/07731-0 CEP. Written informed consent was obtained from both adolescents and a parent or guardian.
Inclusion criteria required adolescents to have a weight between the 10 and 90 percentiles, and height between the 10 and 97.5 percentiles for each age group [16], with an adequate Body Mass Index (BMI) for their age [17], and regular consumption of dairy products.
Exclusion criteria were: those with a history of prematurity or low birth weight; those presenting diabetes mellitus, acute or chronic undernutrition, congenital or acquired bone diseases, gastrointestinal diseases accompanied by malabsorption, history of nephropathy with or without chronic renal insufficiency, endocrinopathies, early or late puberty, chronic drug consumption, cystic fibrosis, celiac disease, drug use which negatively affects bone metabolism such as anticonvulsants and antacids with aluminum, more than 2h/week physical activity, as excessive physical exercise interferes with bone mineralization [18]. Dietary exclusion criteria were: an exclusively vegetarian diet, high dietary fiber, above recommended values of their age plus 5 or 10g/day, or over 30g/day [19], caffeine, >300 to 450mg/day, approximately two or three cups of brewed coffee per day [20], or soft drink consumption above 500ml/day [21, 22], and those not consuming dairy products. These rigorous selection criteria were used to minimize interference from factors which can affect normal bone metabolism during puberty; also excluded were those who may have or had used contraception in the 24 months before data collection, or those who had been pregnant at any time. Exclusion criteria also included non-attendance at any stage of data collection.
Data collection began at school, where in the first instance, adolescents were randomly selected, and those not presenting any of the listed exclusion criteria, were invited to have their weight and height measured. Those fitting the criteria were then questioned about smoking and alcohol consumption. Once these questions were satisfied, they were invited to participate in the study as volunteers, parents or guardians were met to explain methods used, and consent requested. Participants and parents or guardians were advised that they could retract their consent at any time during the study without prejudice.
Volunteers and their parents or guardians were then invited to the Adolescent Medicine Outpatient Clinic at Botucatu School of Medicine’s University Hospital - UNESP, where parents and guardians were interviewed, followed by a general and special physical examination so that any physical alteration could be detected. Secondary sexual characteristics were evaluated, and the results compared to the Tanner criteria for breast development (B) [23]. Skeletal maturation was evaluated by obtaining bone age (BA) using the Greulich and Pyle, GP method [24] Chronological age (CA), bone age, and pubertal breast stage (B) were divided in five groups. Group CA1: was composed of 10 year olds, CA2: 11├ 12 years, CA3: 13 ├ 14 years, CA4: 15 ├ 16 years and CA5: 17 ├ 19 year olds. BA groups were divided into BA1: adolescents with bone age (BA) of 10 to 11 years, BA2: BA of 12 to 13 years, BA3: BA of 14 to 15 years, BA 4: BA of 16 to 17 years, and BA 5: BA of 18 to 19 years. In sequence dietary characterization was measured using a non-consecutive 3 day dietary record [25]. Centesimal quantification of food questionnaires was performed using a computer analysis system developed by São Paulo University Public Health Faculty’s Department of Nutrition [26].
Adolescents who completed all earlier steps were then submitted to bone mass evaluation by dual-energy X-ray absorptiometry (DXA) using a Hologic QDR 2000-Plus apparatus from the Clinical Tomography Center – Botucatu. Adequate evaluation of bone mass was achieved using pediatric software and BMD results were expressed in g∙cm-2. Measurements were taken of the L1-L4 lumbar spinal region and the total proximal femur, including the femur neck, trochanteric and intertrochanteric regions, and the Ward area and whole body densitometry. The quantity of radiation to which the adolescents were exposed was considered safe and not prejudicial to their current and future life [27, 28].
Data were analyzed by Anova and the Scheffé test to compare the difference between group means, with α=5% and test power equal to 1, using the Sigma Plot Version 11 software package. These tests were used to compare chronological age (CA), bone age (BA), pubertal stage of breast (B) and bone density. Graphs include median DXA values in relation to age, bone age, and pubertal breast stage. Minimum statistical difference was considered at 5%.
RESULTS
Characteristics of Adolescents
Baseline characteristics of the 72 adolescents studied, grouped according to chronological age (CA), bone age (BA), and pubertal breast stage (B), are presented in Table 1. The number of participants making up each of the CA, BA, and B subgroups is also shown in the table.
Descriptive Characteristics of Adolescents According to Chronological Age (CA), Bone Age (BA) and Pubertal Breast Stage (B) Groups
| Groups (Mean±SD) | |||||
|---|---|---|---|---|---|
| 1 | 2 | 3 | 4 | 5 | |
|
|
|||||
| Chronological Age (CA) | |||||
| N | 8 | 19 | 18 | 14 | 13 |
| Weight (Kg) | 40.12±9.62 | 40.32 ±6.32 | 48.91±7.15 | 51.98±5.91a, b | 55.73 ±5.84a, b |
| Height (m) | 1.44±0.1 | 1.49±0.08 | 1.6±0.05a, b | 1.61±0.05a, b | 1.61±0.05a, b |
| BMI (Kg∙m-2) | 18.7±2.56 | 18.02±2.45 | 18.78±2.07 | 20.22±2.01 | 20.75±1.83 |
| Calcium (mg/day) | 702±166 | 563±289 | 532±149 | 489±153 | 532±267 |
|
|
|||||
| Bone Age (BA) | |||||
| N | 12 | 16 | 16 | 18 | 10 |
| Weight (Kg) | 33.02±4.3 | 45.2±5.73a | 48.86±7.4a | 54.03±6.34a, b | 53.71±4.77a |
| Height (m) | 1.38±0.05 | 1.52±0.06a | 1.61±0.06a, b | 1.62±0.06a, b | 1.63±0.03a, b |
| BMI (Kg∙m-2) | 16.99±1.57 | 19.26±2.58 | 18.74±2.15 | 20.65±1.97 | 20.09±1.45 |
|
|
|||||
| Pubertal Breast Stage (B) | |||||
| N | 8 | 8 | 7 | 28 | 21 |
| Weight (Kg) | 31.92±4.73 | 39.18±5.56 | 45.75±7.98a | 50.27±7.5a, b | 52.57±6.48a, b |
| Height (m) | 1.38±0.05 | 1.43±0.08 | 1.54±0.08a | 1.60±0.06a, b | 1.61±0.05a, b |
| BMI (Kg∙m-2) | 16.24±1.62 | 19.02±2.83 | 18.81±2.18 | 19.41±2.19 | 20.26±1,93 |
BMI= body mass index; N= number of patients studied.
CA1 (10 years old), CA2 (11├ 12 years old), CA3 (13 ├ 14 years old), CA4 (15├ 16 years old), and CA5 (17├ 19 years old).
BA1 (10├ 11 years bone age), BA2 (12 ├ 13 years BA), BA3 (14├ 15 years BA), BA 4 (16 ├ 17 years BA), and BA5 (18 ├ 19 years BA).
B1 (Marshall & Tanner stage I), B2 (Marshall & Tanner stage II), B3 (Marshall & Tanner stage III), B4 (Marshall & Tanner stage IV), B5 (Marshall & Tanner stage V).
Difference between group 1 and other study groups are shown with the letter
Difference between group 2 and other study groups are shown with the letter
a P<0.05.
b P<0.05.
Anova, Scheffé test.
Chronological age was grouped in the following way: CA1, CA2, CA3, CA4, and CA5. There were significant increases in body weight, height, and BMI with advancing age, typical of the intense natural physical growth process during puberty similar to data from the Center for Disease Control and Prevention. The same occurred with bone age when the adolescents were classified as BA1 to BA5. Mean weight and height for each pubertal breast stage increased through the maturation process.
Mean calcium ingestion levels from three days dietary records were similar for all age groups. BMI did not statistically differ between chronological age, bone age, and pubertal breast stage groups (Table 1).
BMD vs Chronological Age (CA)
Fig. (1A) shows mean bone mineral densities evaluated by DXA for the lumbar spinal and proximal femur regions and the whole body, respectively according to adolescent chronological age, subdivided into five groups. Significant differences in BMD were seen for 13 to 14 year olds/CA3 (0.865±0.127 g∙cm-2), 15 to 16 year olds/CA4 (0.881±0.115 g∙cm-2), and 17 to 19 year olds/CA5 (0.940±0.132 g∙cm-2) from 10 year olds/CA1 (0.672±0.082 g∙cm-2) and 11 to 12 year olds/CA2 (0.689±0.083 g∙cm-2) with P<0.05. The same behavior was seen in the proximal femur region and whole body, with respective differences in CA3 (0.906±0.100 g∙cm-2; 0.980±0.102 g∙cm-2) which differed from CA1 (0.738±0.131g∙cm-2; 0.819±0.069 g∙cm-2), and for CA4 (0.930±0.105 g∙cm-2; 1.019±0.076 g∙cm-2) and CA5 (0.932±0.073 g∙cm-2; 1.042±0.069 g∙cm-2) which differed from CA1 (0.738±0.131 g∙cm-2; 0.819±0.069 g∙cm-2) and CA2 (0.770±0.121 g∙cm-2; 0.844±0.085 g∙cm-2).
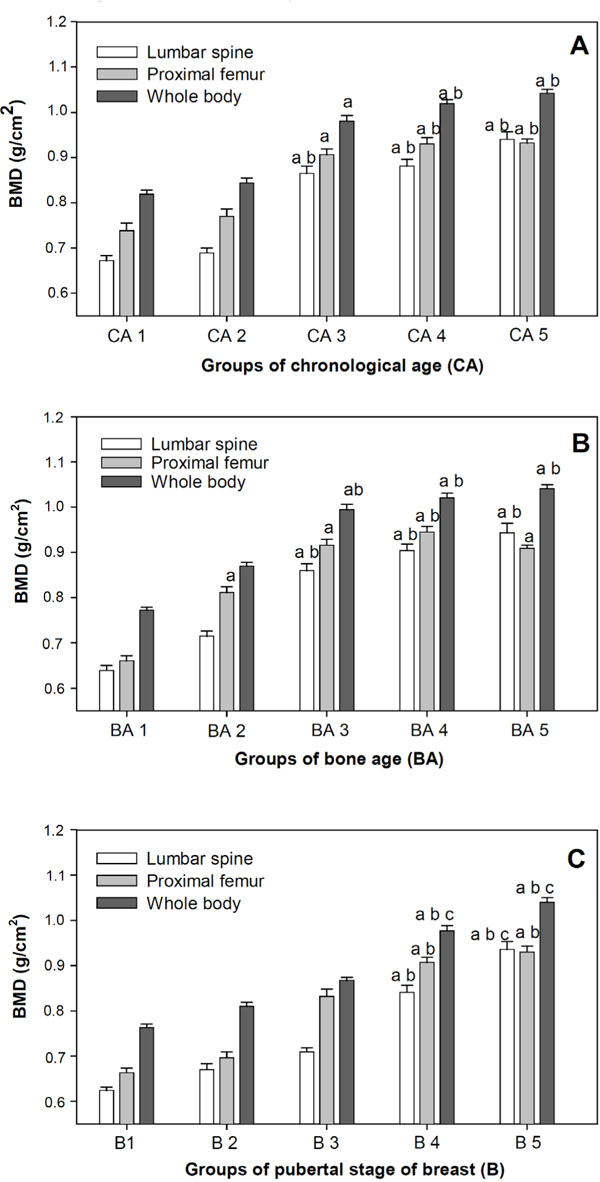
A, B, C – Mean and Standard error of Bone Mineral Density (BMD) of lumbar spine, proximal femur and whole body according to Chronological age (CA), Bone age (BA) and pubertal stage of breast (B).
Difference between Group 1 and other study groups are shown with the letter a, P<0.05.
Difference between Group 2 and other study groups are shown with the letter b, P<0.05.
Difference between Group 3 and other study groups are shown with the letter c, P<0.05.
Anova, Scheffé test.
Fig. (1B) shows mean bone mineral densities for the lumbar spinal and proximal femur regions and the whole body, respectively according to adolescent bone age, subdivided into five groups. Significant differences were seen between BA1 (0.639±0.0082 g∙cm-2; 0.660±0.080056 g∙cm-2; 0.772±0.056 g∙cm-2) and groups BA3 (0.860±0.117 g∙cm-2; 0.616±0.101 g∙cm-2; 0.994±0.095 g∙cm-2), BA4 (0.904±0.109 g∙cm-2; 0.945±0.094 g∙cm-2; 1.021±0.076 g∙cm-2), and BA5 (0.943±0.161 g∙cm-2; 0.909±0.055 g∙cm-2; 1.041 ±0.073 g∙cm-2); with P<0.05 for all evaluated areas. In the proximal femur region there were statistical differences between BA2 (0.715±0.084 g∙cm-2; 0.811±0.098 g∙cm-2; 0.870±0.061 g∙cm-2) and BA1. Also BA3 means differed from BA1 but not BA2 for this region.
BMD vs Pubertal Breast Stage (B)
Fig. (1C) shows bone mineralization parameters compared with breast stage classification to verify which pubertal stages displayed higher bone mass increase. There were significant differences in spinal BMD for stages B4 (0.841±0.115 g∙cm-2) and B5 (0.936±0.130 g∙cm-2) against B1 (0.624±0.053 g∙cm-2), B2 (0.670±0.098 g∙cm-2) and in B5 (0.936±0.130 g∙cm-2) against B3 (0.709±0.073 g∙cm-2). Significant differences were seen in proximal femur BMD for B4 (0.907±0.086 g∙cm-2) and B5 (0.930±0.099 g∙cm-2) against B1 (0.663±0.079 g∙cm-2) and B2 (0.696±0.097 g∙cm-2) with P<0.05. B3 mean BMD (0.832±0.125 g∙cm-2) did not demonstrate significant difference. In total body evaluation, B4 (0.977±0.086 g∙cm-2) and B5 (1.040±0.080 g∙cm-2) differed from B1, B2, and B3 (0.763±0.062 g∙cm-2, 0.810±0.071 g∙cm-2, 0.867±0.056 g∙cm-2, respectively; P<0.05). B1 and B2 BMD levels between the lumbar region, proximal femur region, and whole body were not significantly different; notably however, in B3 these indicators showed a marked biological increase in the spinal lumbar region and whole body.
DISCUSSION
The importance of this study is reinforced by the rigid inclusion and exclusion criteria which differentiate it from other studies to date in specialized literature performed on populations from other countries. Several authors have included or at least not excluded subjects with a previous history of premature birth, low weight, ethnic differences, changes in nutritional state, those performing intense physical exercise and using medications which often negatively or positively interfere with bone metabolism, as well as many other situations which can change bone mass growth in this stage of life. This study mainly focuses on understanding bone mass gain in a population of healthy white female adolescents from a high socioeconomic level, following the most rigid inclusion criteria and its relationship with chronological age, bone age, and pubertal development, classified by breast evaluation. Adolescents who have participated in other regular physical activities, in addition to those run at school, and are considered low impact short duration <2hrs/week, were also excluded as studies in literature confirmed that practicing physical exercise encourages bone mass gain, which could introduce other ways of interfering with results from this uniformly selected sample [18, 29].
During puberty, there are two nearly simultaneous biological events; one is the physical growth spurt, characterized by peak height velocity (PHV), and the other which consists of reaching peak bone mass increase, stressing that PHV occurs two years before menarche, around 11.3 years old, and bone mass increase close to first menarche. Scientific literature has shown that bone mass deposition gains momentum a little after PHV in girls, generally occurring when they are in stages B3-B4, according to Tanner criteria [30]. It is said that 90% of bone mass gain occurs in the first 20 years of life with exponential growth during adolescence. Baroncelli et al. (2005) [5] showed that at least 25% of bone mass is achieved in the two years encompassing peak height growth (PHV) and Cassidy (1999) [31], the WHO, and ISCD [12, 32] proposed that to accept a diagnosis of low bone mass in children and adolescents, results should also be compared to bone age and sexual maturity levels. This refinement in the interpretation of increment or no increment in bone mass for individuals exposed to large physical changes, places great emphasis on understanding bone mineralization, due to the peculiarities of this phase of life, related to growth and biological maturation.
In relation to bone age, our adolescents showed advances in relation to chronological age, but within the normal standard deviation considered by literature. According to Marshall & Tanner (1986) [33], the possibility of obtaining a “uniform” bone age by reaching puberty in normal individuals cannot be defined, as values can normally vary by around two standard deviations. However the same authors showed that skeletal maturation age has a strong correlation with puberty, as sexual steroid hormones released into the blood help advance bone age, an event which has a strong relationship with events seen in puberty. For our group of adolescents, mean BA (14.31 years) was higher than mean chronological age (13.70 years). In Table 1 it can be shown that adolescents distributed over groups CA and BA are of one homogenous form, despite this a large percentage presented advanced breast stages B4 and B5 (68%), suggesting that interpretation of BMD results, taking into account only chronological and not maturational criteria, could be insufficient in some situations that speed up or slow down pubertal development.
BMD results indicated increasing values in all studied regions; the lowest observed in 10 year-olds and the largest in 17 to 20 year-olds. Boot et al. (1997) [34] also evaluated peak bone mass in a longitudinal study with both male and female adolescents; they found that peak BMD for the lumbar spine and whole body occurred between the ages of 18 and 20 years in females. After more than a decade, these same authors presented results from statistical models, using data taken from transverse longitudinal studies, to evaluate peak bone mass attainment in 501 healthy subjects of both sexes, performing whole body, lumbar spine, and femoral neck DXA at three different times, the second 4.3 years after the first, and the third 6.1 years after the second. They concluded that for the 360 female individuals in their sample, peak BMD occurred in the lumbar region at 17.8 years and in the whole body at 19.9 years of age [10]. In our study, differences began in the 13 to 14 years age group, and when the girls reached pubertal development stage B4, this could be seen in all lumbar spine, proximal femur, and total body regions [35]. Visually, this gain began to accelerate (Fig. 1C) when the girls entered into B3, which did not mean that bone mass deposition did not continue at all evaluated sites in stages B4 and B5. Other studies have shown that BMD values in the lumbar spine (L1 to L4) for girls are higher than for boys in the 12 to 15 age band, possibly due to the effects of hormonal cascade, which advances their pubertal events compared to boys [5]. The higher susceptibility of the female to sexual steroid action is in trabecular bone which is mainly found in vertebra [5]. Trabecular bone is metabolically more active and responsive to functional changes in the organism which explains why this is where bone loss starts in both sexes in the third decade of life and total bone mass declines 6 to 8% every ten years. We can also see that the response to a drop in estrogen is more intense, with a big acceleration in bone remodeling and a loss of 5% to 10% bone mass per year in 40% of women suffering post menopause osteoporosis, or that with a drop in estrogen bone remodeling accelerates where reabsorption activity is higher and at the end of each cycle there is a significant decline in bone mass [5].
Kalkwarf et al. (2007) [36] concerned with determining bone mass in children and adolescents between 6 and 16 years of age, identified that the lack of bone mineral gain in this stage of life is linked to microarchitecture disruption during senility. They evaluated bone mineral density in 1554 Americans from different geographical locations, using DXA in 761 boys and 793 girls, of which 462 were pubescent girls from different ethnic origins. Our results are similar to their results when analyzing the 50 percentile for non-blacks in the lumbar spine, proximal femur, and whole body.
However, despite rigid inclusion and exclusion criteria, they included children small for their gestational age and those whose BMI was up to the 97th percentile, therefore overweight and obese [34]. Without adequate information as to what percentage of their individuals were included in these conditions, making up the final sample, one could infer that their results, relative to the medians, were displaced up or down [36]. Our study looked at the association of BMD with bone age and secondary sexual signs, also suggested by Cassidy (1999) [31], the WHO and ISBD, a situation that undoubtedly adds value to our results allowing readers to interpret them against a series of biological maturation indicators, which helps in the explanation and understanding of bone mineralization gain.
As to the role of dietary calcium; daily ingestion varied from 489±153mg/day to 702±166mg/day, with a mean of 563±215mg/day. Although these values were less than the 1300mg/day recommended in Dietary Reference Intakes (DRI) for a population of the same age band, we were able to detect an increase in BMD. Studies by other authors on BMD and calcium intake have shown that in some countries, average consumption by female adolescents is lower than DRI values, but with evident BMD gain [37, 38]. For example, El Hage et al. (2010) [39] showed that daily calcium intake in Danish eutrophic adolescents was 783±285mg/day with BMD values of 0.891±0.108 g∙cm-2for the lumbar region and 0.756±0.114 g∙cm-2 for the femoral neck, which are similar to our results. This suggests that the complex mechanisms surrounding ingested calcium use and its bioavailability could both be involved in this question [40].
Molgaard et al. (2009) [40] reported a recent review by Cochrane identified that calcium supplement in children and adolescents has little effect on BMD in arm bones; stressing that spinal BMD was more subject to estrogen exposure than to increased calcium intake or supplements.
Estrogen (ER) and Vitamin D (VDR) receptors may be distributed in a different form on different bone types, as well as having individual differences. Genetic studies on the variability of Vitamin D and estrogen receptors have suggested that individuals who express specific types of receptors can have different types of BMD in function of VDR and ER receptors. Thus the use of calcium and its influence on BMD could be linked to the genetic variability of these receptors [40].
Our study did not give special attention to understanding these mechanisms or the possible relationship between ingestion and bone mass uptake, as it was a transverse study; however we suggest that future studies look at the importance of adequate calcium intake and its repercussions in bone mass increase in the Brazilian population. We stress that cohort studies on adolescent populations who ingest DRI recommended levels of micronutrients, would be extremely important in bone mass gain comparisons.
Such considerations highlight the need to stress the importance of dietary education with the aim of promoting an adequate intake of this and other groups of nutrients, and to contribute in the specific case of calcium, to the subject of youngsters obtaining adequate peak bone mass, thus reducing the risks of low bone mass which in future life can lead to osteopenia and osteoporosis [41].
This study has some limitations, such as the small number of adolescents making up the sample, being a transverse study, as well as using only one manufacturer’s densitometry apparatus (Hologic), which could make comparisons with our results difficult for other services when using different DXA equipment. Also hormone level measurements could have added to this study, as estrogen and insulin-like growth factor-1 (IGF-1) are essential for reaching physical maturity, growth, and adequate bone mineralization. Following adolescent distribution by Tanner stages, it is possible to show that they present adequate endogen and estrogen production rates as 56 (78%) presented stages ≥ B3, physical evidence of their hormonal changes. Thus, indirectly by observing puberty stages, it is possible to infer that increased estrogen production modulated the GH-IGF axis, and that hormonal cascade acted on linear growth and bone mineralization, as stated in literature [42].
Therefore, interpreting bone mass evaluation by DXA using standard curves based on the main variables (ethnicity, age, gender, anthropometric measurements, and pubertal development) should guarantee a better interpretation of BMD in clinical practice and guarantee a new understanding of bone mass and its variations in adolescence, data which will certainly contribute to a better quality of life in adulthood, as adult osteoporosis is inversely proportional to peak bone mass acquired in infancy and adolescence.
CONFLICT OF INTEREST
None declared.
ACKNOWLEDGEMENT
Supported by FAPESP (Fundação de Amparo à Pesquisa do Estado de São Paulo) - Process No: 2007/07731-0